Walking A Fine Line Here - Weekly Market Outlook
Walking A Fine Line Here - Weekly Market Outlook
In retrospect, last week's bounce wasn't have been a total surprise. Most of the market's major indices were approaching major support levels, as we've previously discussed. Will the momentum continue or will the bearish volatility return?
We'll look into that, right after a quick look at all of last week's and this week's economic numbers.
Economic Data
Last week's economic news didn't get us started on the right foot. The moderate expectations for retail sales growth report ended up being too high, chart below.
Retail Sales, YOY Growth Chart
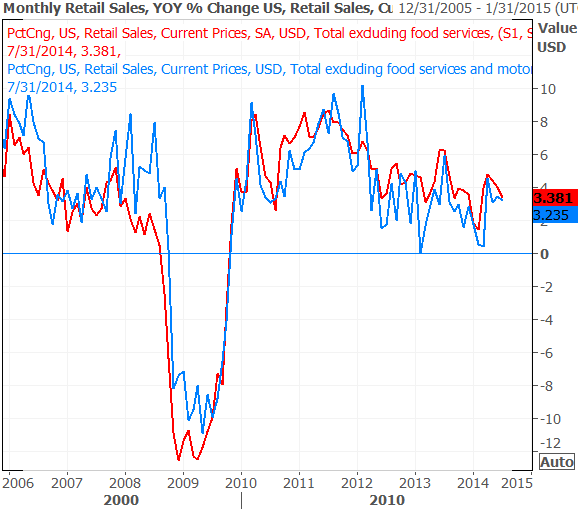
Source: Thomson Reuters Xenith
We didn't hear any other significant news until Friday, when we got a double dose of announcements.
First we heard about July's producer price inflation rate. Although this figure isn't the more important consumer price inflation data due this week, the PPI data can be something of an omen of what's to come on the consumer front. It doesn't appear we have much to worry about, however. As of last month, the annualized producer price inflation rate stands at 1.7%. We may once again want to be more worried about deflation.
Consumer and Producer Inflation Rates Chart
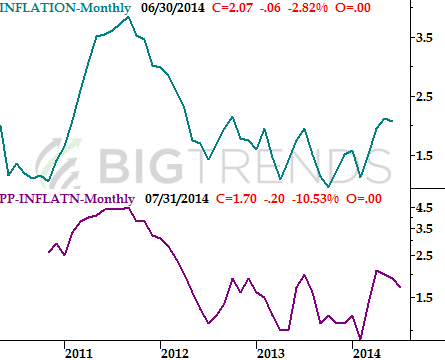
Source: Bureau of Labor Statistics
Finally - and definitely most importantly - on Friday we heard about the nation's capacity utilization rate and its industrial productivity. Both were up in July. Capacity utilization ramped up from 79.1% to 79.2%, while productivity grew by 0.4%. As long as these two data sets are rising, the country remains in a state of economic expansion. That's good for the long-term market, even if it doesn't smooth out all the short-term bumps.
Industrial Production & Capacity Utilization Chart
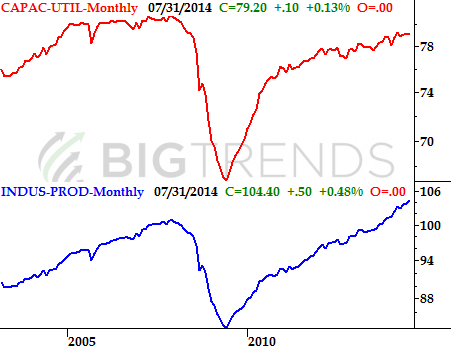
Source: U.S. Federal Reserve
Everything else is on the grid.
Economic Calendar
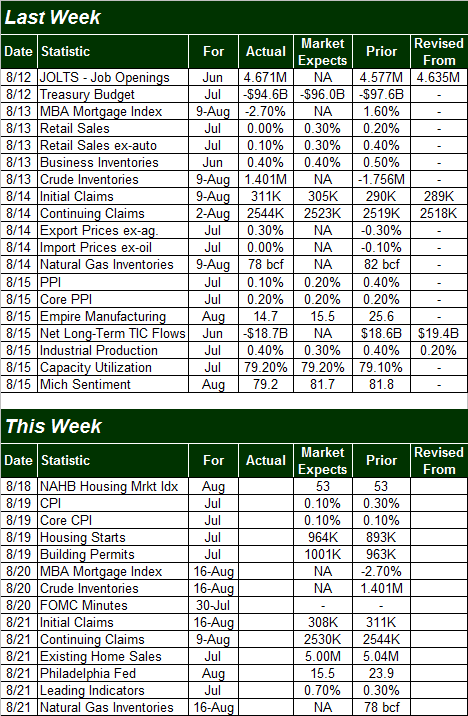
Source: Briefing.com
The coming week isn't going to be a terribly busy one either, but it's going to be an important one for the housing and construction market, kicking off a two-week stretch of data regarding the sector. That party gets started on Tuesday with July's housing starts and building permits figures. The pros currently see a little growth in the cards for both.... some much-needed growth. On Thursday we'll hear about last month's existing home sales, which are expected to slide a little lower from June's levels, though bear in mind June was a pretty strong month for sales of existing homes. Our chart of all the real estate trends tell the mixed tale.
Real Estate Data Chart
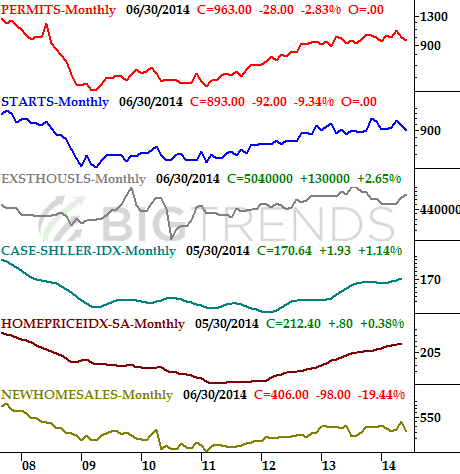
Source: Census Bureau, National Assn. of Realtors, Standard & Poor's, and the Federal Housing Finance Agency
We'll also be rounding out July's inflation data on Tuesday when we get the official reading for consumer inflation rates. As of right now, forecasters don't expect to see any real inflationary pressure. In fact, the annualized consumer inflation rate is expected to fall, as the producer price inflation rate did last month.
Stock Market Index Analysis
Last week, the S&P 500 (SPX) (SPY) gained 23.47 points (+1.2%) to close out at 1955.06. It was the second winning a week in a row, though this one was much bigger than the first. And in retrospect, it shouldn't come as a surprise the market bounced. There were several floors from which the S&P 500 could have used as a springboard, and though it only needed one of them, it looks like it used all of them.
One of these key floors is plenty evident on the daily chart... the 100-day moving average line (gray), currently at 1918.37. The S&P 500 brushed it two weeks ago - closed a tad under it one day, in fact - and immediately began to rally again. Problem: Though it rallied quite nicely, the rally seems to have hit an impasse right as the 20-day (blue) and 50-day (purple) moving average lines were encountered. This doesn't mean the index has to reverse again and head lower. On the other hand, this also doesn't mean the market is in a position to move higher.
S&P 500 & VIX - Daily Chart
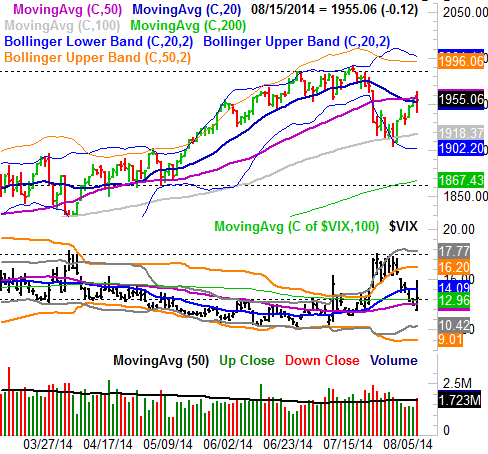
All charts created with TradeStation
It's also worth noting the market bottomed at the same time the CBOE Volatility Index (VIX) (VXX) hit a technical ceiling of its own. Like the S&P 500, the VIX has moved into a confluence of support around 12.8, and is somewhat acting like it wants to move higher again.
The weekly chart of the S&P 500 also could explain why the market bounced over the course of the past two weeks - a long-term, rising support line (dashed).
S&P 500 & VIX - Weekly Chart
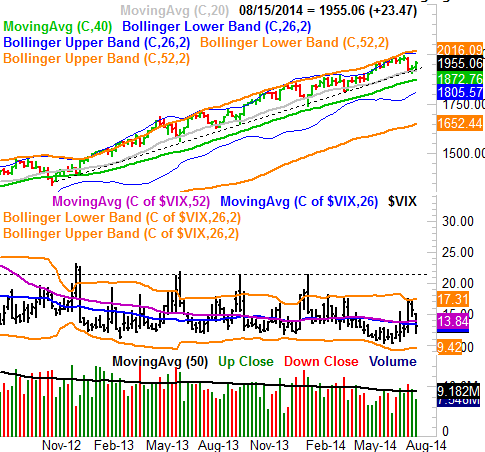
It's admittedly something of a mixed bag, though more bullish than bearish. The momentum is still pointed upward in both timeframes, and though there's some indecision on the daily chart, the shorter-term 20-day and 50-day moving average lines are less potent as support and resistance than the 100-day moving average line is.
That being said, it's much easier to make a bullish judgment call on the S&P 500 when we also know the NASDAQ Composite (COMP) (QQQ) has performed quite well of late, hurdling the major lines in the sand the S&P 500 couldn't yet. Specifically, the NASDAQ has managed to cross above its 20-day moving average and its 50-day moving average line.
NASDAQ Composite & VXN Chart
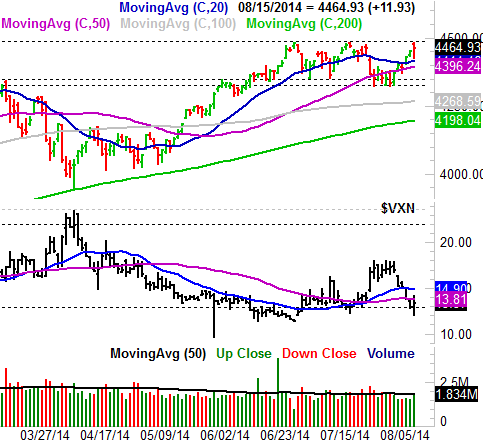
Of course, it's a little troubling to see the composite has for a third time stalled at 4488.0 As of right now, we have strong reason to think the bulls aren't comfortable carrying the NASDAQ any higher than that. The Nasdaq Volatility Index (VXN)'s upward reversal effort from Friday underscores that concern. If we do crack the ceiling at 4488.0 though, and tip-toe into new multi-year high territory, it could be an explosive event.
Bottom Line
The momentum may be bullish, but between an overbought and overvalued market [the S&P 500's trailing P/E ratio is 17.4] and the fact that August is generally a bearish month, we can't afford to be too optimistic. The rub is, even one more bullish day could spark a renewal of the bigger rally. But, don't expect that rally to last long or go very far. We're likely just not in an environment ready to muster big gains... if any gains at all.
Whatever the case, this week is a pivotal week. But, we won't be too worried until and unless we see the S&P 500 break under the 100-day moving average line, at 1918.37.
Trade Well,
Price Headley
BigTrends.com
1-800-244-8736