Volatility Remains A Concern - Weekly Market Outlook
Volatility Remains A Concern - Weekly Market Outlook
After five straight days of losses for the market, even Friday's big gain wasn't enough to leave the market higher for the week. That makes the third consecutive week of lost ground for stocks, though there are some hints that the bulls are sensing there's something of a floor materializing near last week's lows (which were pretty well aligned with the previous week's lows).
Don't misunderstand that observation - the bulls still have a ton of work to do if they want to convincingly put the market back on a bullish track. In fact, the indices are still on the bearish side of the key short-term moving averages. Friday's bounce, however, took shape at the best and most likely rebound levels the market could have used in that capacity.
We'll tell the story using charts below. First, let's paint a bigger picture with a closer look at last week's key economic news.
Economic Data
It was a pretty busy week last week on the economic front, and most of the data was a little discouraging. Let's just work through the big ones, in order of appearance.
On Wednesday we learned retail sales weren't all that hot for December. Retail consumption slipped 0.9%, and retail spending not counting automobiles fell 1.0%.
Retail Sales, Period-Over-Period Change Chart
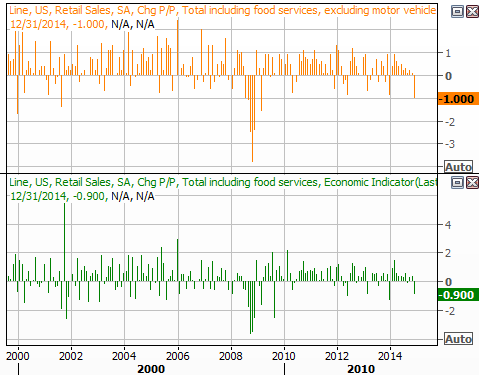
Source: Thomson Reuters Eikon
The numbers were a little misleading, in that the total retail sales figure includes gasoline sales, and gas prices have been plunging with the price of oil of late... especially last month. In fact, total purchases outside of gasoline were basically flat. That, however, IS the concern. Most have theorized cheaper gasoline prices would mean those savings would be spent on other types of goods. They weren't. At least not yet.
Inflation continues to slide lower too, stemming mostly from slack demand rather than oversupply. On a wholesale basis - producer price inflation - prices fell 0.3% overall and only grew 0.3% not counting energy and goods. Consumer price inflation was negative overall as well, falling 0.4%. On a core (less food and energy) basis, consumer inflation was flat.
Inflation Chart
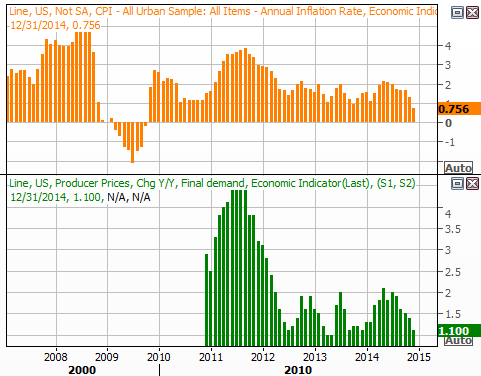
Source: Thomson Reuters Eikon
Finally, industrial production and capacity utilization both slipped a little last month. Production fell 0.1% in December, according to the Federal Reserve's figures, while capacity utilization (of factory output potential) moved from 79.9% to 79.7%. We've discussed previously that these economic indicators have tended to correlate with stock market performance.
Capacity Utilization and Industrial Production Chart
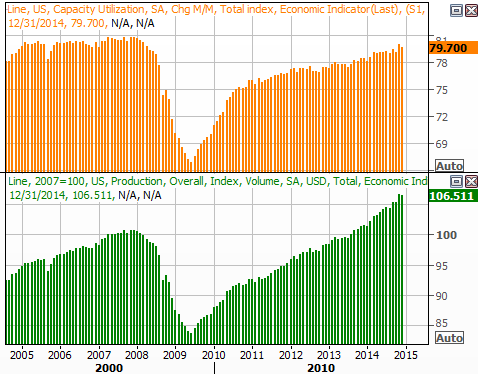
Chart and data provided by Thomson Reuters Eikon
Interestingly, the consumer is still feeling good even though businesses may have a little reason to be worried. January's final reading on the Michigan Sentiment Index came in at 98.2, up from December's 93.6. That's the strongest reading in a decade.
Economic Calendar
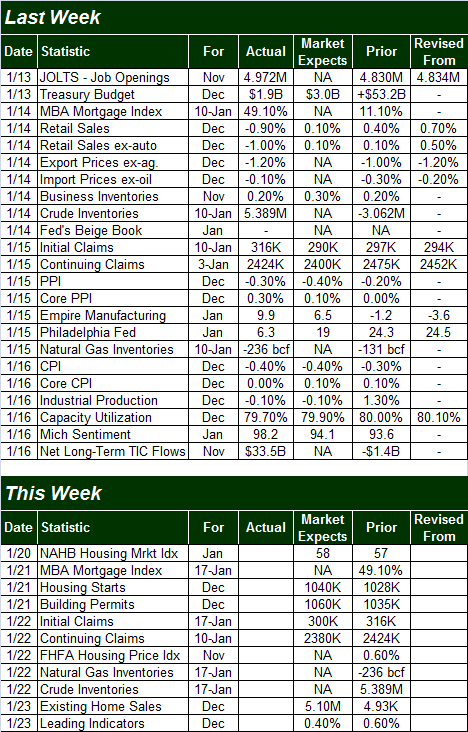
Source: Briefing.com
This week isn't going to be quite as busy, but it's going to be a huge week for real estate data - pricing, and construction activity. We'll have the detailed results a week from now. For today, the charts of all the key trends through November offer some perspective on where things may be going.
Real Estate Trends Chart
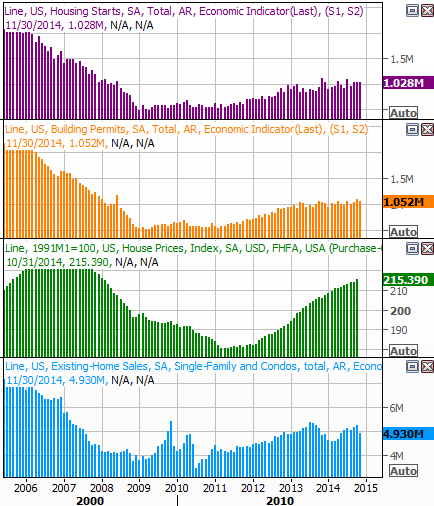
Source: Thomson Reuters Eikon
Stock Market Index Analysis
Just to set the stage - and avoid some confusion - the market is currently sending mixed messages. We'll explore both sides of the coin, just in the interest of fully understanding all the possibilities that could unfurl this week. Also note that though we're only going to examine the S&P 500 (SPX) (SPY) here, the other market indices (DIA) (QQQ) (IWM) look about the same, and are interpreted the same at this time.
The bearish camp will be quick to point out that the MACD lines for the S&P 500 are not only pointed in a bearish direction, but both are below the zero level.... a subtle clue that the bigger trend is a developed bearish one. One can also see the Percent R line toyed with a move below the 20 level last week. Although we ended up not closing below 20 thanks to Friday's bounce, we're within striking distance of another move back under 20. If we get it, that retest is going to be a convincing clue that the bears have decisively taken charge, and that the bulls blew their chance at a rebound.
S&P 500 & VIX - Daily Chart
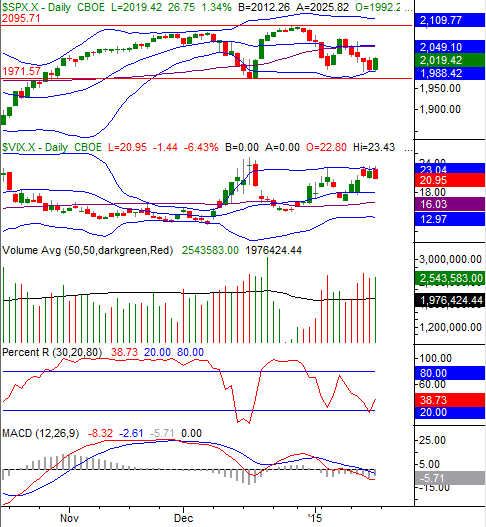
Chart created with TradeStation
The bullish arguments include the fact that the S&P 500's lower 20-day Bollinger band stepped up to the plate as a support line, halting the downtrend on Friday before it was allowed to spin out of control. We can also see the CBOE Volatility Index (VIX) (VXX) has stopped its ascent at its upper 20-day Bollinger band, suggesting the market believes all the potential downside at this time has run its course.
When we zoom out to a weekly chart of the S&P 500, Friday's turnaround actually makes a lot of sense.
We've seen the 26-week moving average line serve as a near-perfect support level since early 2013, and last week's lows were right at that key line again. Until the S&P 500 moves below the 26-week moving average line at 2003, we have to give the bulls the benefit of the doubt.
S&P 500 & VIX - Weekly Chart
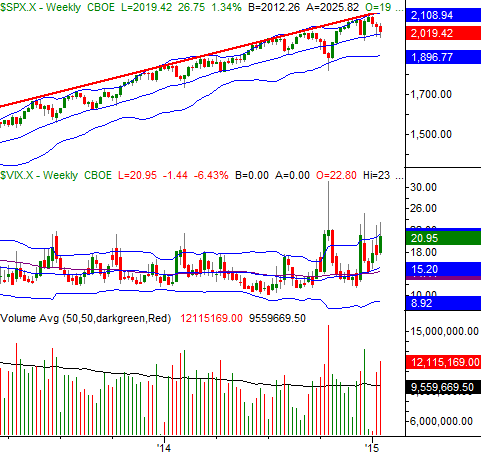
Chart created with TradeStation
The key concern worth noting on the weekly chart of the S&P 500 is the continued rise of the VIX. Yes, on the daily chart it looks like the VIX's rally has stalled... and maybe it has. In this longer-term timeframe, however, it's starting to look like the VIX is already in an uptrend. This implies a more substantial headwind for stocks in the foreseeable future.
If the VIX closes above its upper band line at 21.5 this week and/or the S&P 500 closes below 2003, that's apt to trigger another round of selling and a likely retest of the weekly chart's lower band currently at 1897. On the flipside, a break above the S&P 500's now-converged 20-day moving average line and 50-day moving average line at 2049 could be somewhat catalytic, forcing at least a retest of the 2095 ceiling. Anything in between, and stocks are just stuck in a no-man's land and not confirmed as ready to make a meaningful move. If the index breaks out of its current range, we'll talk more specific targets then.
Trade Well,
Price Headley
BigTrends.com
1-800-244-8736