Valuation Trepidation - Weekly Market Outlook
Valuation Trepidation - Weekly Market Outlook
Ouch. Not that traders didn't have an inkling the market was overbought and perhaps poised for stumble, but few saw coming the suddenness and size of Thursday's drubbing. However it materialized, we have no choice but to at least entertain the possibility that this is the beginning of a much more significant pullback.
We'll slice and dice the details in a moment. The first item we need to cross off our to-do list is a closer look at last week's major economic reports.
Economic Data
One of last week's main economic highlights was July's employment data, which wasn't quite as promising as hoped, and not quite as encouraging as recent reports have been.
The good news is, more people are working now than there were at the end of June. As of July, the nation was employing 146,352,000, which was 131,000 more people than the 146,221,000 that were working in June. The bad news is, the number of unemployed people hit 9,671,000, up 197,000 from June's figure of 9,474,000. How do we get an increase in both figures? Easy - the number of people who count themselves in the workforce (whether they're employed or not) grew from 155,694,000 to 156,023,000... an increase of 329,000.
It's still not clear how or why so many more people joined the ranks of the job-seeking crowd last month, but they did all the same, and it means we took a step back onm the jobs front. The unemployment rate bumped up from 6.1% to 6.2%. Even though we technically added (net) 209,000 jobs in July, the whole jobs situation remains a liability for the economy.
Employment Data Trends Chart
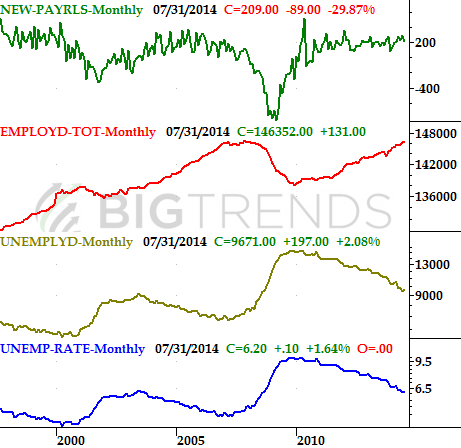
Source: Bureau of Labor Statistics
Interestingly, even with relative weakness in the employment numbers, confidence ticked much higher. In fact, the Conference Board's consumer confidence score hit a multi-year high of 90.9 for July. That's the highest it's been since the bull market and economic rebound began. In fact, that's as high as it was right before the recession began in 2008. The Michigan Sentiment Index wasn't quite as impressive, sliding lower from June's final reading of 82.5 to 81.8 in July. Even so, the overall trend for both data sets says consumers are feeling pretty good. That's critical for sustained economic growth.
Consumer Sentiment Trends Chart
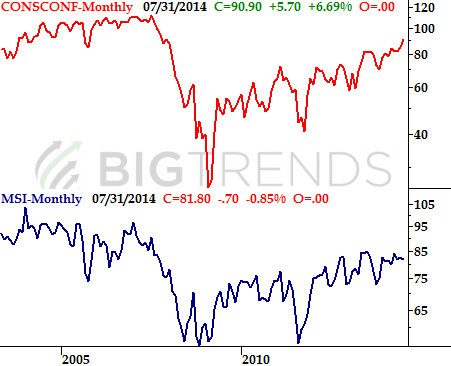
Source: Thomson Reuters and the Conference Board
Finally, though it was an exaggerated jump because of Q1's nasty 2.1% decline, the second quarter's preliminary GDP figure grew 4.0%. Don't look for the same pace of growth in Q3, though the reading does say we're back in a positive trend. Also bear in mind the Q2 figure will be revised a couple more times.
Economic Calendar
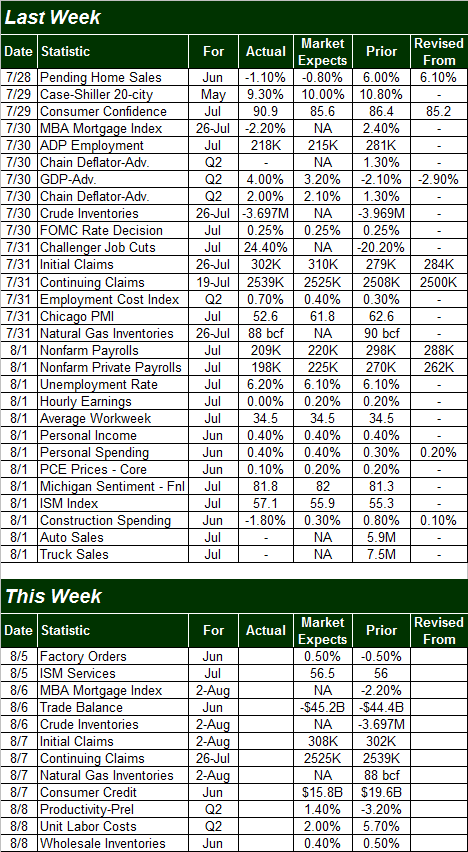
Source: Briefing.com
The coming week is clearly a light one for new economic releases. And, what little data is in the lineup isn't even worth discussing or handicapping. This works out well, of course, since investors have much more on their minds right now than economic reports... like a market that's hanging by a thread.
Stock Market Index Analysis
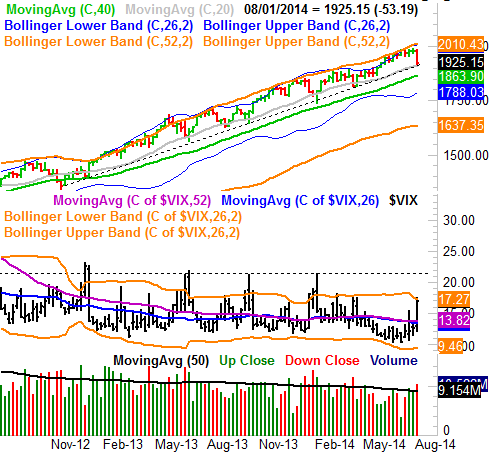
OK, no need to dance around the issue this week - it is what it is. The rug got pulled out from underneath stocks on Thursday, changing everything. The S&P 500 (SPX) (SPY) broke under its key 50-day moving average line (purple) at 1953 for the first time since April. In fact, in April the S&P 500 specifically found support at that moving average three times, with the third time sparking a pretty big rally. Take a look.
S&P 500 & VIX - Daily Chart
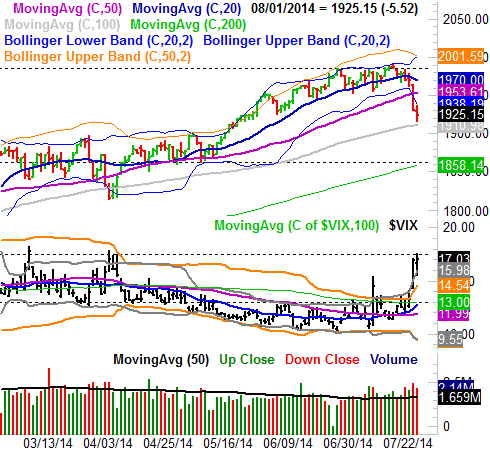
All charts created with TradeStation
While the severity of the damage done most likely precludes a resumption of the uptrend we've all enjoyed since April, there are some clues that suggest we're going to see some near-term bullishness. One of those clues is the fact that the CBOE Volatility Index (VIX) (VXX) has reached a big ceiling of its own, at 17.5. As you can see on the daily chart above, the last two times the 17.5 level was hit by the VIX, the market made a minor and then a major bottom. It's also modestly bullish that Friday's bar was doji-like, and slowed down right as the 100-day moving average line was approached.
That's not the only reason we could see a near-term spike take shape here. In the weekly timeframe the S&P 500 is also finally at a very long-term rising support line (dashed) that's been in place since late-2012.
S&P 500 & VIX - Weekly Chart
A bullish investor would argue that this long-term support line is simply going to do its thing again, bumping the market higher as it has several times for nearly two years now. And, on a purely technical basis, it's not a bad argument. There is a key difference between then and now, however. This time, stocks have a valuation problem.
The chart below tells the story. Back in late-2012 the market's trailing P/E was a reasonable 14.6. Now it's a frothier 17.6, and had been as high as 17.7 at one point last month. That's on the upper end of tolerable. Actually, it's beyond the upper limit for stocks.
S&P 500 with Per-Share Earnings and P/E Ratio Chart
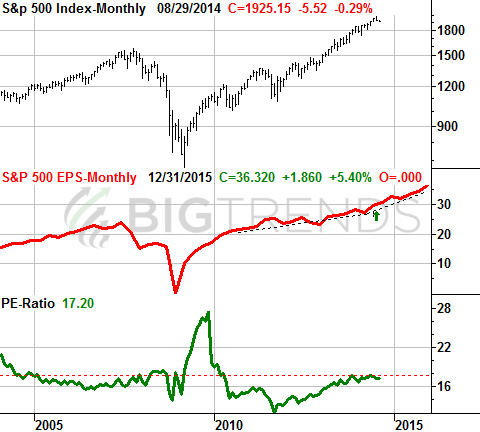
There's something else that makes that situation worse.
In the expansion phase of a normal bull market, the P/E ratio usually falls until we hit an economic peak and start a recession. That's when the P/E ratio normally starts to rise. Since late-2011 though, the P/E ratio has somehow managed to rise because stocks have ascended faster than earnings have. That's a dangerous situation, if only because it suggests investors are expecting - maybe demanding - something the market simply can't deliver. In fact, if you look closely at the above chart, you can see the earnings projections pick up the pace... as in double-digit growth for the next four quarters. That's a growth pace we've not seen sustained in many, many years. The current pullback may at least be partially the result of investors realizing the long-term outlook may be a little too optimistic.
Whatever the underlying long-term mindset is, while odds are good we'll get a little bit of a bullish pushback this week, unless the S&P 500 can break above the 1965-ish area in a hurry, this may be an omen of a long-overdue, bigger-picture correction. The first checkpoint target is still the 1860 area, give or take, if the bears take hold again after the dead-cat bounce.
Trade Well,
Price Headley
BigTrends.com
1-800-244-8736