Undeniable Loss Of Momentum - Weekly Market Outlook
Undeniable Loss Of Momentum - Weekly Market Outlook
And thus ends the rally. Thanks to Friday's steep selloff, all the major indices ended in the red for the week. While the optimists may be able to just chalk it up to a little volatility, from an unbiased, scientific point of view, there appears to be more working against the market than for it. That's not to say stocks can't rekindle the rally that was so bullish between late-2012 and March of this year, but the market's going to have to work very hard to undo the damage that's been done since then and get back in a bullish groove.
Our index analysis below will tell that story. Let's first dissect the market's underpinnings ... the recent economic data.
Economic Calendar
It wasn't a terribly busy week in terms of economic numbers, but it was a pretty big week for real estate data, building on the real estate and construction numbers we heard a couple of weeks ago.
You might recall that the week before last week, housing starts and building permits were relatively flat, prolonging a lethargic period for the real estate market. Things didn't get any better last week on that front. Existing home sales fell to a pace of 4.59 million, which is the lowest reading we've seen since late-2012. New home sales also fell to a multi-month low pace of 384,000. Although home prices remain modestly on the rise (according to the FHFA and Case-Shiller numbers), that doesn't offset the fact that few homes are selling, and fewer homes are being built.
Real Estate and Construction Trends Chart
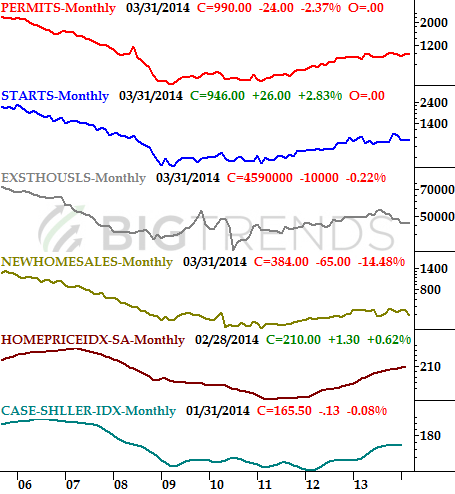
Source: Census Bureau, FHFA, Standard & Poor's, and Briefing.com.
It wouldn't be accurate to say the real estate market is in dire straits here, but it's clearly no longer one of the economy's shining stars.
Economic Calendar
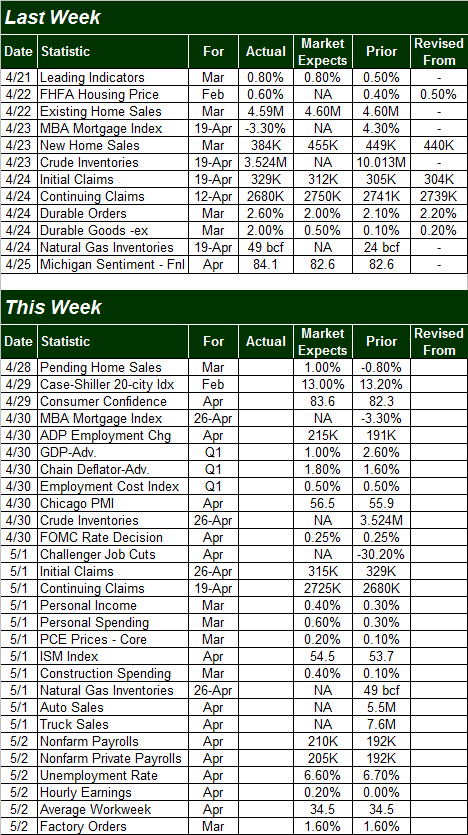
Source: Briefing.com.
This week will clearly be busier one, with a huge does of employment news coming later in the week. We're going to hear some other big news before that, however, like April's consumer confidence score... to be posted on Tuesday. The Michigan Sentiment Index already jumped quite a bit for April, up to 84.1 from March's final reading of 80.0. The pros are thinking the Conference Board's consumer confidence score should be up to 83.5 for April, from March's 82.3. Not that either measure was in jeopardy of beginning a downtrend, but an uptick here would really further solidify an already-impressive uptrend (which is great for the long-term trend, but doesn't exactly stave off a short-term market correction).
Sentiment Trends Chart
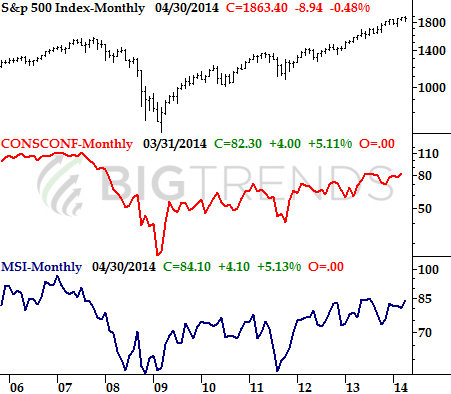
Source: Conference Board and Reuters/University of Michigan.
Of course apart from earnings reports, the focal point this week will be the employment data due on Friday, although we'll get something of a preview of that data on Wednesday with the ADP employment change (payroll growth) figure. Economists say the ADP growth rate will show the addition of 215,000 new jobs - up from March's 191,000 new jobs - which roughly jives with the expected increase of 210,000 payrolls from the government's official tally. That should be enough to move the unemployment needle from a rate of 6.7% to 6.6% for April.
Payroll Growth & Unemployment Chart
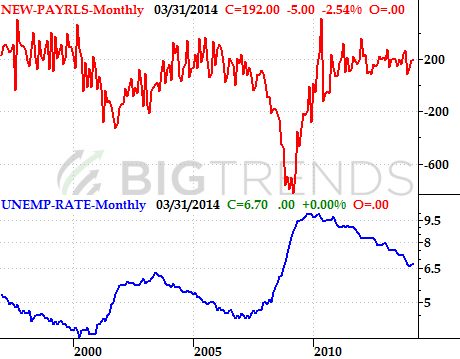
Source: Bureau of Labor Statistics.
While we continue to make basic progress on the jobs front, it's still not good enough to really pull the economy out of its slump. We need payroll growth closer to 300,000 jobs per month to really light a fire under the economic engine.
Stock Market Index Analysis
Let's start with an up-close look this week, zooming into a daily chart of the S&P 500 (SPX) (SPY). Once again, the ceiling at 1885 stopped the rally, and ultimately reversed it. This is the third time the 1885 level has been a problem (and the fourth time, if you count the brief pop above that line in early April), so we can't ignore it - even if only for psychological reasons, until 1885 is cleared, the S&P 500 is more prone to a pullback than a breakout.
S&P 500 & VIX - Daily Chart
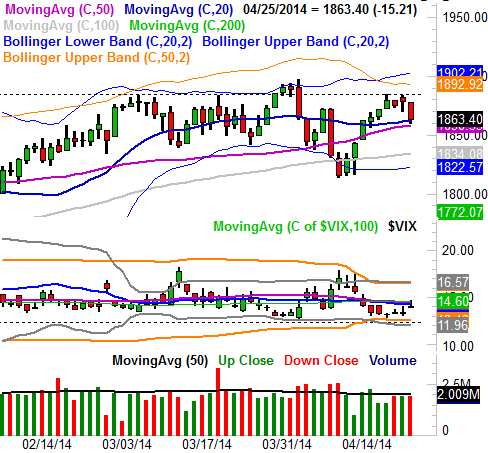
All charts created with TradeStation.
On the flipside, though stocks took a hit on Friday, the 20-day moving average line (blue) - and the 50-day moving average line (purple) to some degree - halted the pullback. Maybe it was just a coincidence, or maybe the bulls are doing their best to prop the market up here, and have drawn a line in the sand there. Either way, until the 20-day and 50-day lines fail to act as a technical floor, then stocks have a fighting chance at a recovery.
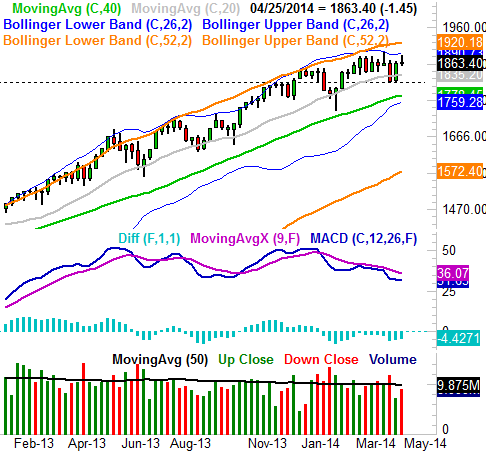
Still, it's all but impossible to deny that the market is losing momentum.
It was something that one could partially sense a couple weeks ago, but without any technical proof, it wasn't an idea that was well-received. That's changed as of last week, partially because we just made a lower significant high [last week's peak was 1885, versus the early-April peak of 1897]. Even more telling of weakness... falling MACD lines on the weekly chart below. We've actually seen a bearish divergence from the MACD indicator since January, but it's getting progressively worse (i.e. more bearish) even though it feels like the S&P 500 itself is holding its ground.
S&P 500 - Weekly Chart
With all of that being said, while the S&P 500 may have a fighting chance at a recovery, the NASDAQ Composite (COMP) (QQQ) is much deeper underwater, and may well be beyond salvaging. It's a problem, because the NASDAQ leads the market, up and down.
Sorry it's scrunched-up, but we had to cram a whole lot of daily bars for the composite into the chart just to make the point - not only is the NASDAQ under its 100-day moving average line (gray) for the fist time in over a year, it actually tried to cross back above that line early last week and found it had turned into a resistance line... after it has been a support line a few times since this time last year [highlighted in yellow]. To see a support level turn into a resistance line isn't a good sign.
NASDAQ Composite & VXN - Daily Chart
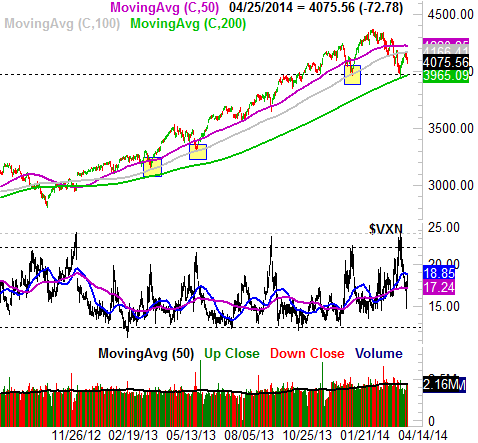
The NASDAQ Composite has its own last-ditch line in the sand too, however... 3970. That was where the index found a floor the last couple of times it bounced its way out of a pullback, and it's where the 200-day moving average line (green) is now. Until that floor is broken, the composite has a fighting chance at wiggling its way back into an uptrend. Regardless, it's pretty clear the NASDAQ has already fallen out of 2013's bullish channel.
When you zoom out to a weekly chart of the NASDAQ, things don't look any better. In fact, they look worse.
The fact that the NASDAQ is overbought is pretty clear on the weekly chart, and it comes as no real surprise that the weight of those gains is starting to bear down now. That's not the problem, or the proverbial red flag. The worry is that the NASDAQ's volatility index, the VXN, is starting to trend higher in the weekly timeframe. This isn't just a few days worth of "up" for the VXN either. Our clue that the VXN is pushing upward now lies in the fact that the 26-week moving average line (blue) has moved above the VXN's 52-week moving average line (purple), suggesting a paradigm shift in how much risk traders are seeing on the horizon.
NASDAQ Composite & VXN - Weekly Chart
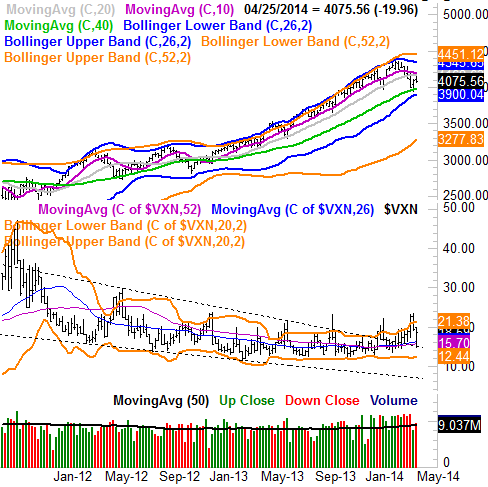
If the NASDAQ's volatility index really is beginning a more prolonged rise, it may not find a ceiling until it gets to - or even above - the 30.0 level. It's going to be tough, though not impossible, for the composite to shrug such a move off.
It's not a reason to run for the hills yet; the NASDAQ has plenty of potential support around 3970, and the weekly chart's lower 26-week Bollinger band at 3900 could swoop in and act as a floor too. We're just saying if the bears play their cards right, they could easily cause a lot of pain in a short amount of time. Let's cross that bridge when we come to it though. For now, all of the indices are in the middle of well-established ranges. This week could be very telling.
by Price Headley
BigTrends.com
1-800-244-8736