The Trend, While Scary, Is Still Your Friend - Weekly Market Outlook
The Trend, While Scary, Is Still Your Friend - Weekly Market Outlook
Despite a few potential landmines on the battlefield, the market managed to navigate them successfully last week, en route to a 0.95% gain. The move still doesn't actually negate the bigger risk of a pullback (more on that below). Then again, the trend is the trend, like it or not. And right now, after three consecutive weeks of gains, the trend is bullish as we pass the MLK holiday.
We'll take a detailed look in a second, right after running down some of last week's economic numbers. There was a lot of it, and a great deal of it was pretty important.
Economic Calendar
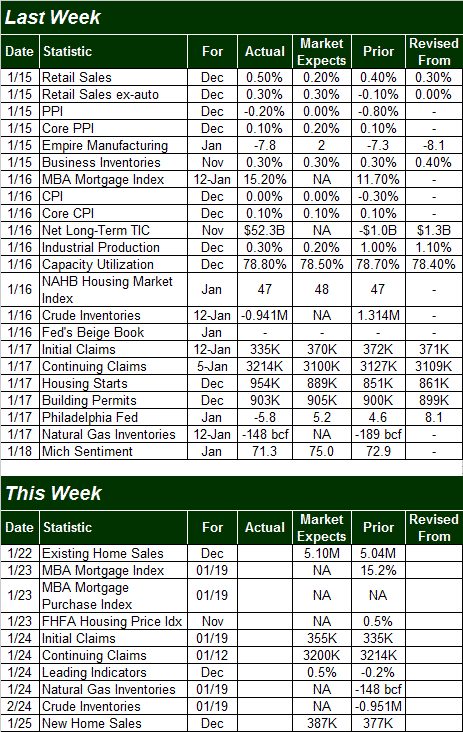
There's no room or time for a lot of fanfare. Let's just get to the highlights, in order of appearance.
On Tuesday, we learned that retail spending for December was as mediocre as expected, up 0.3% (right on target) without autos, and up 0.5% (versus expectations of a 0.2% increase) when including cars.
We also learned on Tuesday that producers aren't feeling or seeing an inflationary pinch. The PPI reading actually fell 0.2% in December, and on a core basis (ex food and energy) was only up 0.1% (versus expectations of a 0.2% rise). It was the second month in a row that factories, assemblers, and fabricators felt input-cost relief.
And yes, the savings that producers are enjoying are being passed along to consumers. The overall CPI measure didn't budge in December, and even when taking food and energy costs out of the picture, consumer costs were only up 0.1% last month. As it stands right now, the annualized inflation rate is 1.74%... a bit on the low side, though fears of deflation aren't merited yet.
S&P 500 Vs. Inflation
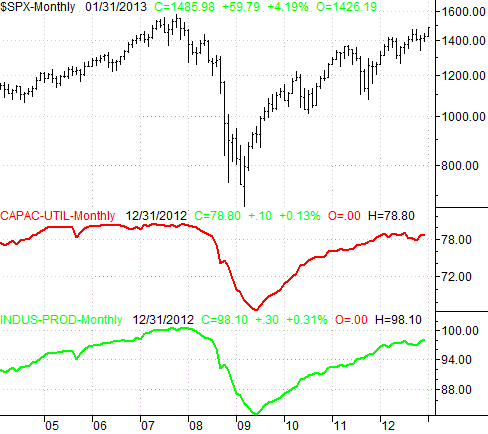
 Also on Thursday we got two other major economic data nuggets - perhaps the two biggest ones of all - in the capacity utilization and industrial productions data. Both not only showed growth, but better-than-expected growth. Capacity utilization reached a five-month high of 78.8%, and the industrial productivity index stands at 98.1... a new multi-year high. We were slightly concerned about the lull in these numbers in the latter part of last year, but were resting a little easier when things started to improve with both numbers around September. Now, however, there's little more we can expect from these measures. Given the strong correlation each was with the long-term market (measured in weeks or months, rather than days), you may want to act think accordingly with the buy-and-hold pieces of your portfolio.
S&P 500 Vs. Industrial Productivity and Capacity Utilization
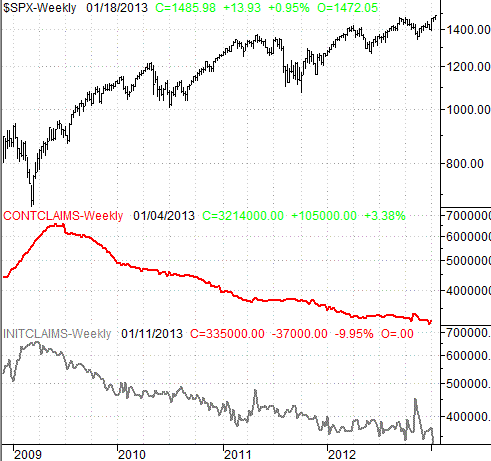
 Thursday was also an exciting day on the employment front; initial claims fell to a multi-year low of 335K. Is it a big deal? It's not as big as it was being made out to be. The new-claims number has been sliding lower since 2009, and has reached new multi-year lows several times in the process. This instance only extends that trend. The same goes for the continuing claims figure that hit multi-year lows a couple of weeks ago... it's compelling, but not game-changing.
S&P 500 Vs. New and Continuing Unemployment Claims
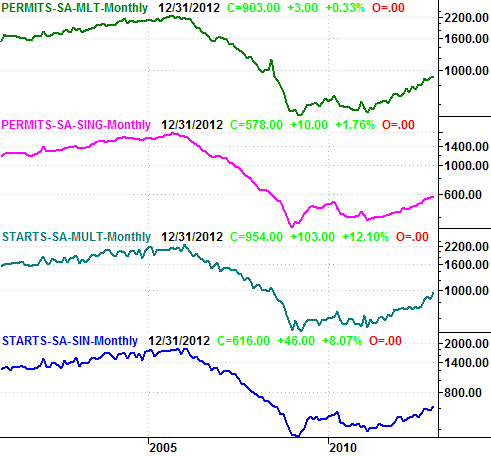
 Finally (and also on Thursday), we got the beginning of an update on the real estate and construction market. It's still good, and in some ways, as good as it's been in years. Starts and permits were both at multi-year highs.
Housing Permits & Starts
 Economic Calendar
 Though the coming week will clearly be a lighter one in terms of the amount of data we'll be digesting, we're still due for some key figures.
For instance, on Tuesday we'll continue to round out real estate's report card, with existing home sales. The pros are saying to look for an annualized rate of 5.10 million, which would be a multi-year high as well, second only to the surge in home sales (to a pace of 5.38 million) from November of 2009. The 2009 pop was never built to last, however, while the current trend has been building for a while, on firm footing. We'll lay the final piece of the real estate puzzle with Friday's new home sales figure. Experts expect a pace of 387K, which would also be a multi-year high.
Stock Market
Last week we left off with the stance that the market was overdue for a healthy correction. That wasn't a prediction, mind you, as we're in an environment where emotions are highs, rhetoric is acted upon, conviction is low, and data is subject to multiple interpretations. Translation: What's historically likely and what's actually going to happen aren't jiving at all. As it stood last week, "stocks are apt to keep going higher because they've been going higher" was just as valid of a theory as anything else.
Be that as it may - and despite last week's bullish effort - the bulls have yet to acknowledge and diffuse their biggest problem right now, which is the simple fact that stocks are overbought, and traders are hesitant now that the S&P 500 (SPX) (SPY) is struggling to hurdle its upper Bollinger Band lines in the bigger-picture weekly timeframe. Take a look.
S&P 500 & VIX - Weekly
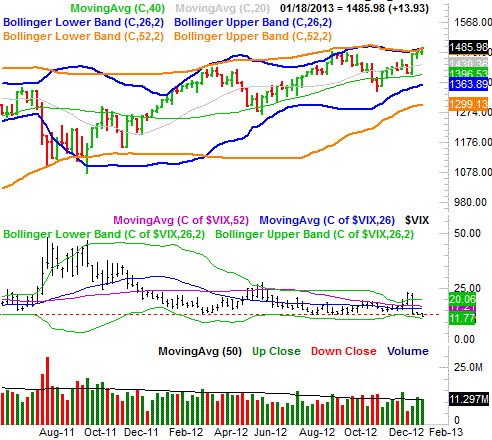 None of this is to say that the market can't or won't plow above those upper bands this time around (it has happened before). But, it's the less likely outcome here. Note one or both of the upper band lines capped the rallies and prompted pullbacks the last two times they were bumped. This time could be different, but is there a clear reason it will be different?
Simultaneously, the CBOE Volatility Index (VIX) (VXX) may technically be trending lower, but at this point it's officially reached uncomfortably low levels... new multi-year lows.
There's more detail on the daily chart, particularly with the VIX. As you can see below, the VIX finally broke under that floor at 13.50, hitting that new multi-year low at the same time the S&P 500 marched into multi-year high territory.
S&P 500 & VIX - Daily
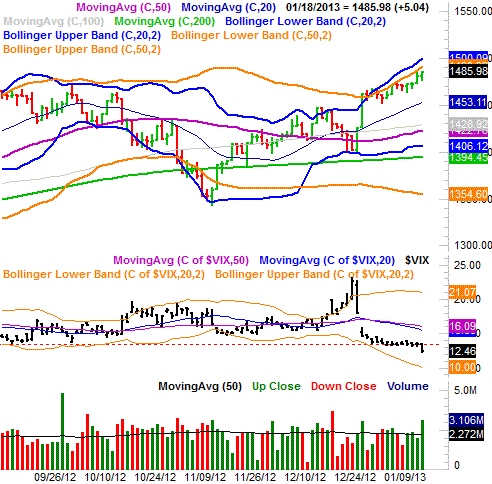 On the surface it's all technically bullish, and perhaps even more so knowing the VIX has room to keep moving lower before hitting a hard floor at 10.0 (where its lower Bollinger Band is resting). Yet, the whole thing seems very unsettling, and difficult to believe. How much of it is organic and long-lasting, and how much of it is chatter-based and unlikely to last?
That's not to say we have to be bears here. Indeed, some of the very best trades are often born out of the market's occasional mania, right or wrong. We're just saying, enjoy the ride as long as it lasts, but be prepared to bail out quickly, especially now that earnings season is here. After all, earnings can make or break a trend - we'll delve into the latest earnings season in an upcoming article.
Trade Well,
Price Headley
BigTrends.com
1-800-244-8736

