The Major Trends Since The 2009 Market Bottom - Weekly Market Outlook
The Major Trends Since The 2009 Market Bottom - Weekly Market Outlook
Is a significant correction overdue?
Though it wasn't easy or pretty, the market managed to eke out a small gain last week... the fourth in a row, and the seventh winning week in the last nine. Oh yeah - the market hit new all-time highs in the process too.
Of course, nothing has changed about the fact that stocks are still overbought, and if the bulls are going to remain in charge they're going to have to do something pretty amazing. The S&P 500 (SPX) (SPY) is already up 6.3% since the early October low, which a pretty good run for the current hot-and-cold environment.
Even more amazing than that is the fact that the market has gone for more than two years without a 'normal' correction of 10% or more. All told, stocks are up 60% since mid-2011... the last time we saw a major capitulation. That pullback was fueled by the sovereign debt crisis in Europe and alarming economic data for the United States.
We'll illustrate the extent of the potential pitfall in a moment. Let's first look at as much economic data as we can. It was really piled on last week.
Economic Calendar
There's just no way we can look at all the data from last week. Let's just stick with the highlights, starting with September's capacity utilization and industrial productivity. The former grew from 78.0% to 78.3%, while production ramped up by 0.6%. Both are strong improvements, and point to long-term economic growth even if a few other red flags were waving last week.
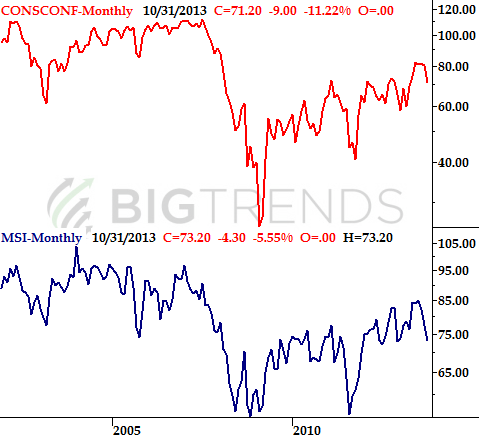
One of these red flags was a drastic plunge in consumer confidence. The Conference Board's consumer confidence figure fell from 80.2 to 71.2 ... the lowest reading in months. The dip appears to have only been fueled by fears linked to the government budget and debt-ceiling fiascos, however, which means the dip may be undone by next month's report . Note that the Michigan Sentiment Index also fall rather sharply a couple of weeks ago, even more sharply than the Conference Board's measure.
Consumer Confidence Chart
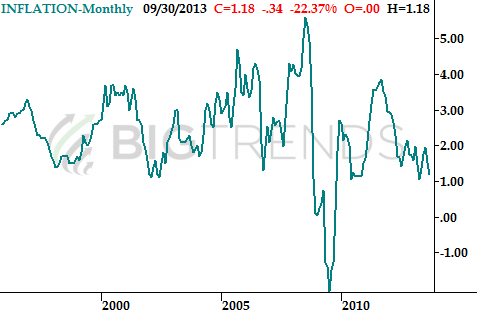
Finally, the current inflation rate now stands at 1.18%, though that's September's figure - not October's. Still, it's the lowest figure since April, and it's an alarmingly low reading. Indeed, we're teetering on deflation, which in some ways is worse than rampant inflation.
Inflation Chart
There's more on the grid below, but if you look closely you'll see most of the data is for September, as the government is still playing catch-up from the shutdown (and even then not all of September's data has been posted, while some of October's has been delayed).
Economic Calendar
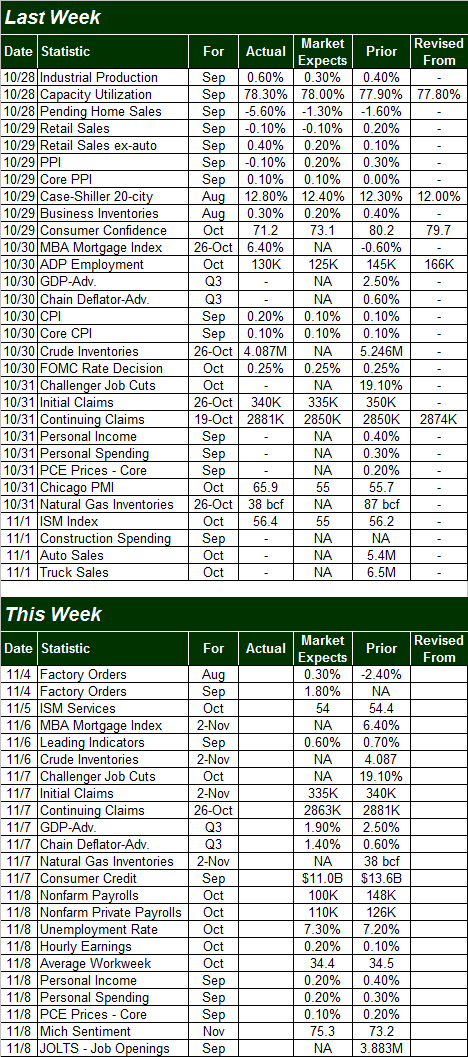
The coming week shouldn't be quite as busy, but still a busy one compared to the average as we continue to work through much of the data that had been on hold thanks to the federal government's freeze. There are only two areas we're really interested in though... Q3's GDP growth, and last month's jobs/employment situation.
GDP-wise, the market has likely braced for a slight taper, from Q2's 2.5% to 1.9% this time around. It's unlikely investors are going to be tolerant of any figure weaker than 1.9%, however.
As for the employment picture, we'll get glimmers on Thursday with the Challenger job cuts level and last week's unemployment claims; ongoing as well as new claims should roll in about the same as their previous readings. The biggie, of course, is going to be Friday's unemployment report. The pros are looking for a slight increase, from 7.2% to 7.3%, with rather anemic net job growth of 100,000 payrolls, down from September's 148,000 new jobs. The number jives with the ADP figure from last week, which indicates there were only 130,000 new jobs created in October.
Everything else is on the grid above.
Stock Market Index Analysis
We mentioned above just how far the market has run without a major - and perhaps healthy - pullback. It's not like that's an abstract idea we can't quantify or illustrate for you, however, so let's start this week's near-term chart analysis by showing you just how odd this rally (near-term and long-term) has become. The chart below tells the tale. T he current rally has translated into the most uninterrupted point gain we've seen since the bull market began [where 'uninterrupted' means we've not suffered a pullback of 10% or more].
S&P 500 - Primary and Secondary Trends Since 2009
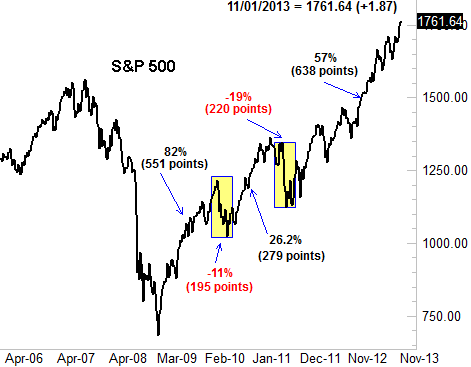
Oh, we've gotten bumped around a little, with a 9% drop in May of 2012. But, most of dips have been on the order of 5%, which is just enough to keep investors confident and willing, but not enough to hit the proverbial 'reset' button for the market. We really need a good capitulation, so we don't have to worry about another dip every time the market gains anything more than 7%.
Problem: Judging from the daily chart, there's still no real evidence we're going to make that capitulatory plunge anytime soon.
Check out the daily chart of the S&P 500 below. The wide up and down swings are quite apparent, with most of them being kick-started by an encounter with one or both of the key Bollinger bands (20-day and 50-day). Given the pattern, the rally should have started to deteriorate before last week. But, it didn't. Instead, the SPX has held its ground right there, remaining in position to make another bullish go of it. It's not been perfect bullishness, mind you, but we sure haven't seen any kind of bearishness yet. If we were going to, it should have materialized by now.
SPX & VIX - Daily Chart
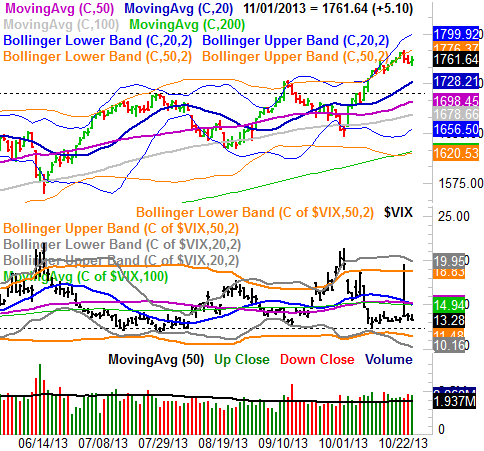
By the way, you can disregard the odd high from the CBOE Volatility Index (VIX) (VXX) for Wednesday. It was an errant tick that for some reason hasn't been cleaned up yet. Speaking of the VIX, though it remains at uncomfortably low levels, the market doesn't seem to mind. In fact, if you squint just right, it almost looks like the VIX is being pressed downward again... with a little room to keep sinking. If the would-be rally is to really get impressive though, the VIX is going to have to do something pretty amazing - move under the horizontal floor at 12.30 (dashed). It's not out of the realm of possibility, with the VIX's lower Bollinger band lines around 10.0 or 11.0.
The weekly chart doesn't actually add much new perspective; it shows an overbought market that's still going strong. There is one curious detail on the weekly chart, however, that suggests more bullishness isn't out of the question. See if you spot it.
S&P 500 & CBOE Volatility Index - Weekly Chart
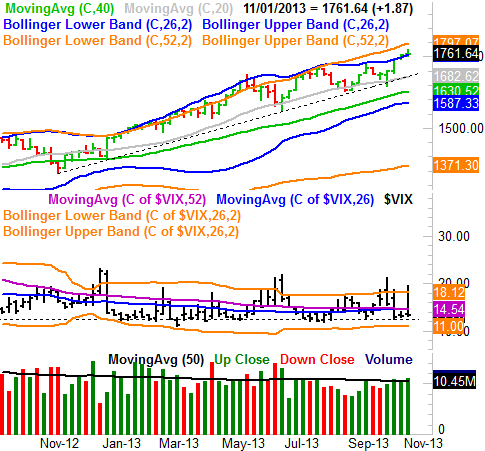
It's volume. We're finally seeing volume levels grow on the way up. This was one of the missing ingredients with previous (failed) recent rally efforts, but it's sure not missing now.
It's possible the volume inflow is the lead-in for the usual year-end really. Thing is, it doesn't matter. If all these buyers are sure enough that it's going to happen they're pouring in now where they hadn't before, they're apt to create a self-fulfilling prophecy. Just keep any trades on a short leash, and watch for the VIX to close above the 14.50 level. That'll be the big sign that the undertow has turned bearish.
Trade Well,
Price Headley
BigTrends.com
1-800-244-8736