Stuck In The Middle - Weekly Market Outlook
While it wasn't in an overly dramatic fashion, the market lost a little ground last week. The loss, however, isn't the troubling part. The troubling part is the way in which stocks retreated, and what the bulls weren't able to do when then they took their shot on Thursday and Friday.
We'll highlight those red flags in a second. First, let's set the context by dissecting last week's major economic numbers.
Economic Calendar
We got more than a little bit of economic data last week, though only a small piece of it was important. Among the "important" numbers were the wave of housing and real estate data we heard early on in the week. In a word, the real estate picture continues to look... mixed.
How so? The Case-Shiller Index was up 0.8% on a year-over-year, seasonally-adjusted basis (though down a bit from December), the FHFA said its housing price index grew 0.5% for January, and the Census Bureau reported that new home sales for February fell to 440K, down from January's pace of 455K. Paired with the previous week's mixed data (permits, starts, and existing homes sales were up, flat, and down, respectively), we can safely say that the real estate and construction market are quite mediocre, having flattened out in most cases.
Case-Shiller and FHFA Home Price Indexes Chart
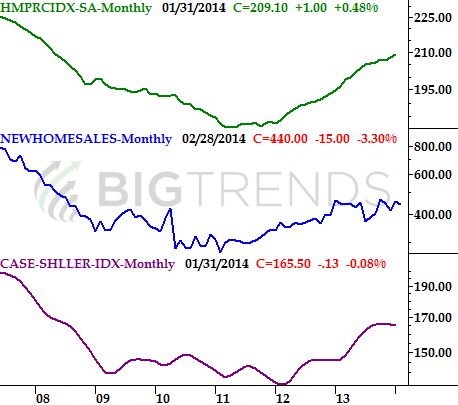
Source: U.S. Census Bureau and the National Association of Realtors
Pending home sales (not plotted on our chart) slipped 0.8% in February, making the real estate picture even fuzzier.
Consumer sentiment is also a mixed bag. The Conference Board's consumer conference reading rose from 78.3 to 82.3 for March, while the Michigan Sentiment Index fell from 81.6 to 80.0. Much like the housing and construction market data, the consumer opinion data continues to give us a mixed message.
Michigan Sentiment and Conference Board Consumer Confidence Chart
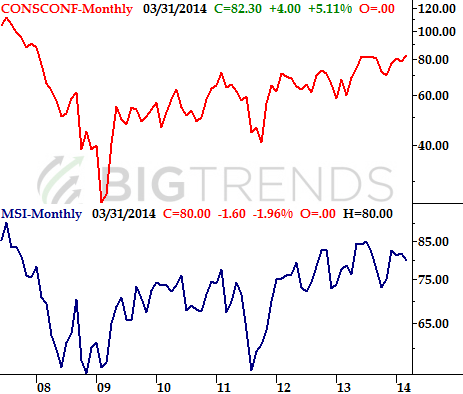
Source: Thomson-Reuters, University Of Michigan, and Conference-Board.org
That being said, there were a couple of bright spots last week - durable orders were up 2.2% when counting transportation orders. Though durable orders were only up 0.2% taking planes, trains, and automobiles out of the equation, it's still progress; transportation is a huge piece of the economy.
We were also glad to see personal income as well as personal spending were both reasonably strong in February; each advanced 0.3% (which is a lot, for that particular data).
All in all, we see more working for the economy than working against it, though it's not a completely lopsided situation. This broad economic health won't stave off short-term pullbacks for the market, but it's a favorable tailwind for the long-term market.
Economic Calendar
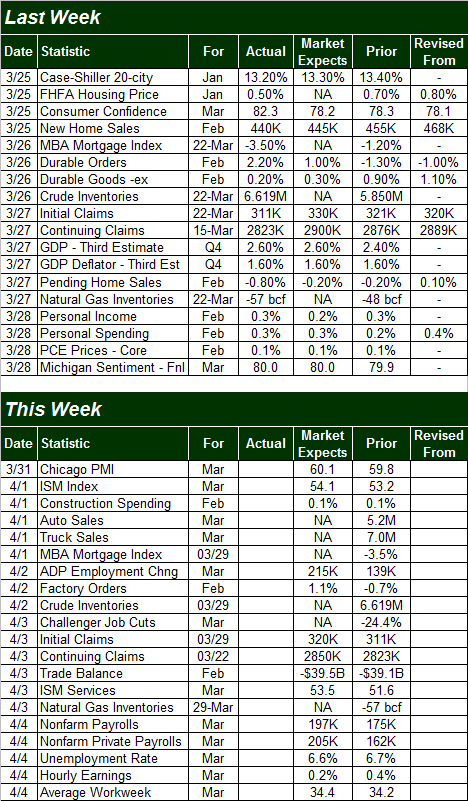
Source: Briefing.com
The coming week will be just as busy in terms of the amount of economic data in the lineup, but little of it will matter until Friday, when we hear March's unemployment data. Economists say the unemployment rate is on pace to fall from 6.7% to 6.6%, on the heels of 197,000 newly-created jobs. That would be a better showing than February's total of 175,000 new payrolls.
Note that there's little to no room for error with the unemployment data. On the flipside, should the numbers come in better than expected, it could be a real catalyst in favor of stocks.
Stock Market Index Analysis
There couldn't be a clearer case of "caught in the middle" than the situation we're in right now. The undertow, however, still looks like it slightly favors the downside over the short-term.
Two weeks ago - two Fridays ago to be specific - the S&P 500 (SPX) (SPY) brushed new all-time highs. Less than an hour later it was already retreating, and that retreat followed-through over the course of last week. The S&P 500 made a string of lower highs, and despite Friday's rebound effort, the index still closed below the 20-day moving average line. In fact, the S&P 500 brushed the 20-day line with Friday's high, only to pull back from it.
S&P 500 & VIX - Daily Chart
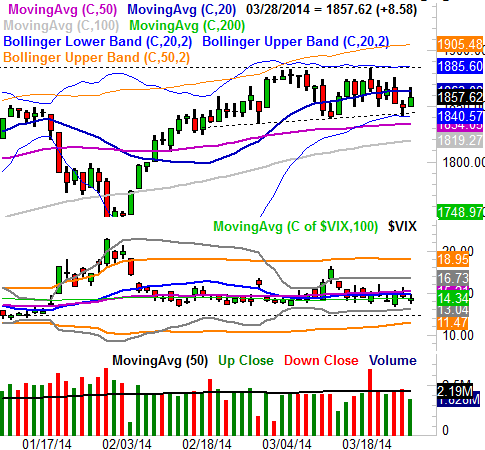
All charts created using Omega Research TradeStation 2000i.
Don't misunderstand - the market is hardly in free-fall mode here. The S&P 500 has a TON of potential support levels between 1835 and 1854 ready to step up to the plate and halt any bearish effort. Those floors consist of the lower Bollinger band, the 50-day moving average line (purple), and even straight-line support (dashed) that tags all the key lows going back to early March. Until the lowest of those support levels is actually broken, the S&P 500 has a fighting chance to get back in a bullish groove without suffering any more major setbacks.
With all of that being said, it's equally clear there's a huge ceiling at 1885. That's been where the index peaked a couple of times since the beginning of the month, and that's where the upper 20-day Bollinger band is resting now. Until/unless the S&P 500 breaks above that resistance, there's no rally worth worrying about.
Like we said, the market is very much caught in the middle here.
For a little more perspective, let's also take a look at the NASDAQ Composite (COMP) (QQQ). Though it's lost a lot more ground than the rest of the market has over the past three weeks, it's still got a key support line of its own... the 100-day moving average line (gray). As you can see on the chart, it's been a major floor for the NASDAQ a few times since mid-2013. In fact, you could say it's been "the" floor for the composite, having never let the NASDAQ Composite slip under it in months. That could change in an instant this week, however, as the index is testing it as a floor as of right now.
NASDAQ Composite & VXN - Daily Chart
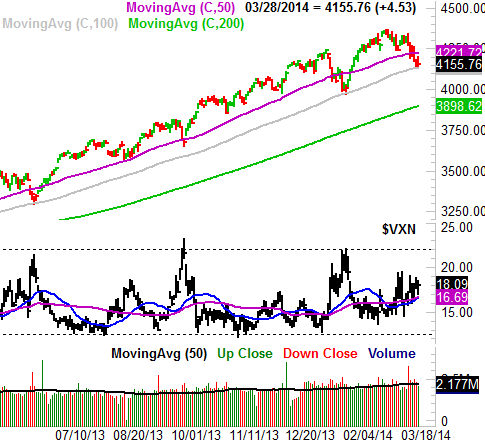
What's different - and scary - about the NASDAQ Composite this time around with its test of the 100-day moving average line is that the Nasdaq Volatility Index (VXN) isn't back to its key ceiling at 22.0. Unfortunately, for the VXN to reach that level and possibly mark the composite's near-term bottom, the NASDAQ will actually have to break under the 100-day moving average line, currently at 4132.
Trouble is, there's no support in sight below the 100-day moving average until we get to the 3970 mark (dashed) where the index found a floor a couple of times since December. The 200-day moving average line (green) at 3896 could be at that level by the time it could be tested, so we'll set a conditional downside target there... IF the 100-day moving average line fails to act as a floor.
Yes, this is going to be an interesting week.
Trade Well,
Price Headley
BigTrends.com
1-800-244-8736