SPX 20 Day MA Violated, What Does It Mean? - Weekly Market Outlook
SPX 20 Day MA Violated, What Does It Mean? - Weekly Market Outlook
Although the week ended on a bullish note, it remains to be seen if Friday's bounce was anything more than a temporary dead-cat bounce. The bulls are still on the defensive here, and will need to prove themselves before stocks can get back into their prior bullish groove. It's the first time the onus has been on the buyers in a while, even though the bears aren't exactly in a spot where they can be smug.
We'll slice and dice the details in a moment. Let's first talk about last week's overarching economic numbers.
Economic Data
It was a pretty busy week on the economic front, so let's just dive right in, starting with the first major item we saw in the economic lineup - June's retail sales. Simply put, while they weren't bad (i.e. they were positive), they weren't as strong as expected. Economists were planning on a 0.7% month-to-month improvement overall, and a 0.6% month-to-month increase when excluding automobiles. What we got was growth of 0.2% and 0.4%, respectively. On a year-to-year basis, this translates into 4.1% and 3.5% growth, respectively. Not bad.
Retail Sales, Year-Over-Year Change Chart
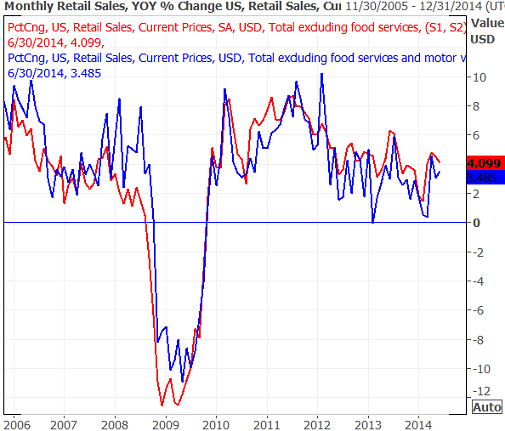
Source: Thomson Reuters
On Wednesday we heard June's capacity utilization and industrial productivity data. Like last month's housing starts and building permits, though the data is basically positive, it wasn't as strong as hoped. Industrial production only grew by 0.2%, falling short of the expected 0.4% uptick. And, capacity utilization fell from 79.2% to 79.1%. Still, both data sets remain in uptrends.
Capacity Utilization and Industrial Production Chart
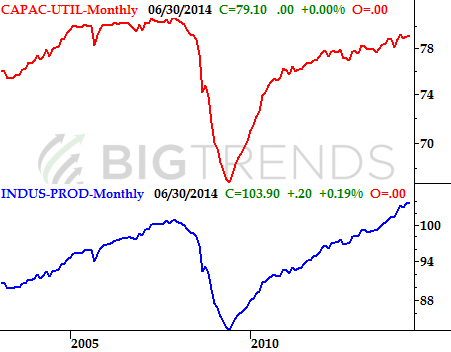
Source: U.S. Federal Reserve
And, construction activity stumbled a bit last month as well. Housing starts fell to a pace of 893,000 units, down from May's 985,000. Building permits fell from a pace of 991,000 to only 963,000 units in May. As the chart shows, this isn't the first weak month we've seen from the starts and permits data. More of the same, and the bigger trend could officially turn south.
Real Estate Trends Chart
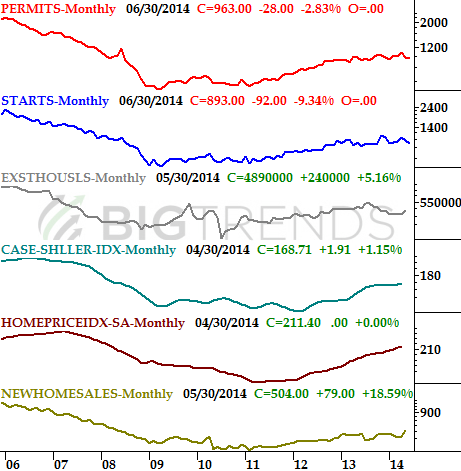
Source: National Board of Realtors, FHFA, Census Bureau, and Standard & Poor's
Everything else for last week is on the grid.
Economic Calendar
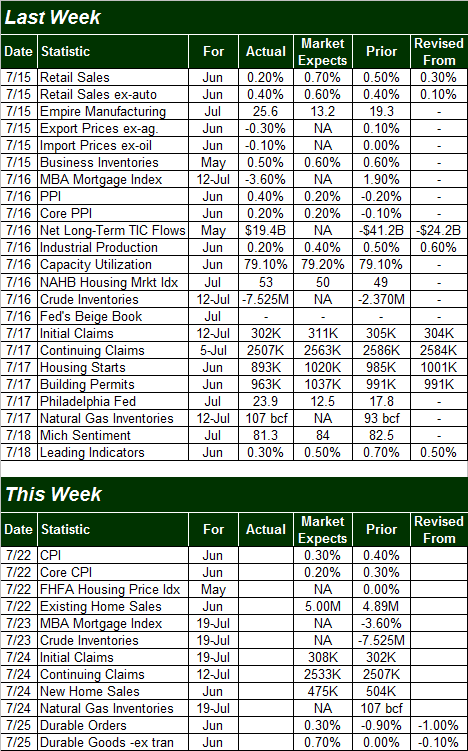
Source: Briefing.com
This week isn't going to be as busy, but we're going to get a big dose of real estate data to add some perspective to last week's disappointing housing starts and building permits. Namely, we'll be getting new and existing home sales as well as the FHFA Housing Price Index. We need some good news on this front, soon.
We'll be kicking things off, however, with Tuesday's consumer inflation data. We got June's producer price inflation rate last week, learning producers (factories, assemblers, packagers, plants, etc.) are now paying 1.9% more for input goods than they were a year ago. That's the second monthly decline in a row - from April's surprise spike to 2.1% - soothing worries that inflation is poised to soar. Though the more important consumer inflation rate doesn't necessarily have to follow the lead of the PPI data, it most likely will... and that's good. The consumer inflation rate spiked to a multi-month high of 2.13% last month, and investors are rightfully worried we'll finally pay the price for years of cheap money. We'll see.
Inflation Trends Chart
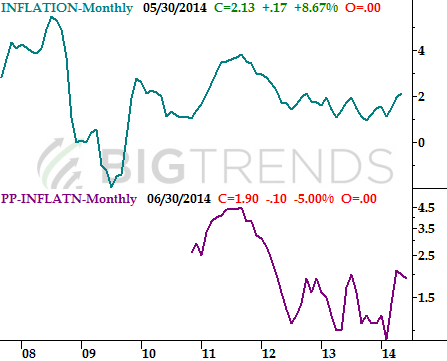
Source: Bureau of Labor Statistics
Stock Market Index Analysis
Thanks to Friday's bounce, the market managed to close in the black for last week. Stocks are hardly out of the proverbial weeds, however. Unless the bulls make a firm statement right up front, the odds of a renewal of the selloff are just as good as a break to new highs. At this point, it's a coin toss.
The daily chart of the S&P 500 (SPX) (SPY) is a clear headache for market handicappers. Thursday's plunge led to the first close below the 20-day moving average lines since May. In a normal environment this should have been a sign of the beginning of a normal (and normal-sized) pullback. We're not in a normal environment, however. Right or wrong, the bulls have refused to let the market implode lately, stepping in before a stumble was allowed to go anywhere. For evidence of that idea, one only has to go back to May. That's the last time the S&P 500 closed below the 20-day moving average line, but the market only let the index move a tad under it before plowing back in again and forcing the market 5.5% higher.
S&P 500 & VIX - Daily Chart
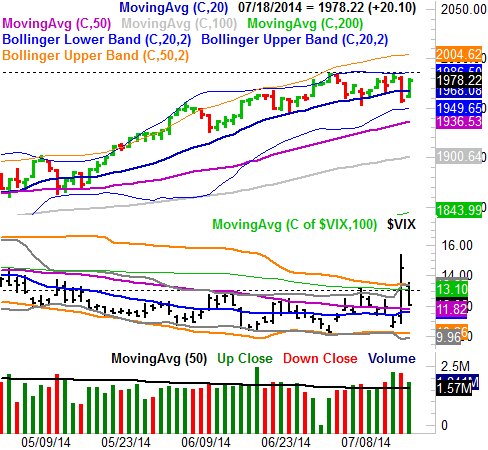
All charts created with TradeStation
The CBOE Volatility Index (VIX) (VXX) was a pretty clear mirror image of the S&P 500 last week, surging on Thursday, but peeling back on Friday. On Thursday, the VIX even popped past a big resistance level around 13.0, suggesting a true shift in the market's paradigm. Yet, it was all undone on Friday at the same time the S&P 500 crawled back above the 20-day moving average line.
So now what? The market's overbought to be sure, but if the S&P 500 can manage to punch through the recently-developed ceiling at 1986, that could end up prodding another bullish thrust. While it's unlikely we'll see another 5.5% runup like we saw in May and June, that technical breakout could still muster a trade-worthy move. Another break under the 20-day line - and especially a close under Thursday's close of 1958 - is apt to push stocks over the edge of the cliff. Anything in between, and we're still on the fence.
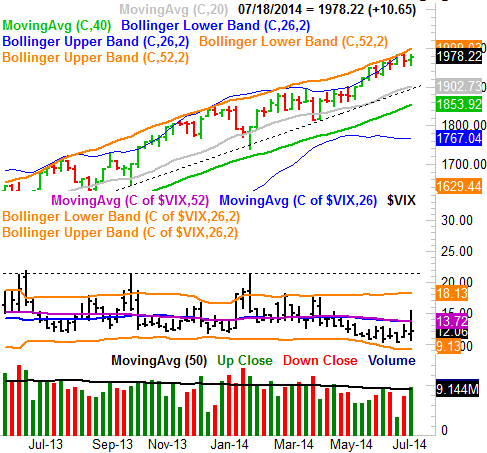
Not a lot changes when you zoom out to a weekly chart of the S&P 500, though the broad uptrend becomes clear. What's also clear is where the index might find a floor should a breakout materialize. The dashed line (and the gray 100-day moving average line) around 1902 has been and likely will continue to be a long-term support area. Just bear in mind both lines are rising fast.
S&P 500 & VIX - Weekly Chart
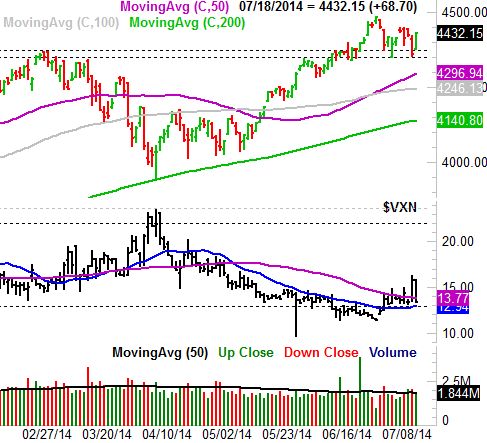
The NASDAQ Composite's (COMP) (QQQ) chart doesn't tell us much else, though it is worth pointing out that NASDAQ still seems to be on the bullish side of some major lines in the sand. Namely, the former resistance line at 4373 is now a floor, and another support level seems to have developed at 4350. Even so, the NASDAQ is fairly overextended as is, and like the S&P 500, there's not a whole lot more room for upside here.
NASDAQ Composite & VXN - Daily Chart
Bottom line: While the charts and the rhetoric may imply the broad market is in "ok" shape, the reality is, Thursday's drubbing showed how vulnerable the market is at this point. While we'd need another really nasty dip to put and keep the bearish wheel in motion, one bad day in the near future is a very plausible possibility. This week is going to be a pivotal week, as both sides of the table are being forced to show their cards.
Trade Well,
Price Headley
BigTrends.com
1-800-244-8736