Pretty Clear Breakout Amid Valuation Challenges - Weekly Market Outlook
Pretty Clear Breakout Amid Valuation Challenges - Weekly Market Outlook
It wasn't necessarily a huge gain for the market last week, but it was an important one. Most indices tiptoed into new-high (record high) territory on Tuesday, and after stalling for a couple of days then made a bold thrust into record high territory again on Friday. All told, last week's close of 2110.3 for the S&P 500 (SPX) (SPY) translated into a 0.6% gain for the holiday-shortened week. Though valuation challenges are going to make it tough for stocks to continue rallying, from the technical perspective this is a pretty clear breakout. Just keep a close eye on it.
We'll examine all the technical details below, but first, let's dissect last week's and this week's upcoming economic numbers.
Economic Data
There was a fair amount of economic news posted last week, but perhaps none as important or as watched as the minutes from the January FOMC meeting. In short, not only did the Fed not raise interest rates, but based on the language used and the discussion between FOMC members, it may take even longer than even first presumed to start ratcheting rates upward.
We also heard last month's housing starts and building permits data. Though starts fell from a pace of 1.087 million to 1.065 million while permits fell from 1.06 million to 1.053 million, a January lull can be normal, and unexpected inclement weather may have been a factor. Either way, both sets of data still remain in longer-term uptrends.
Housing Starts and Building Permits Chart
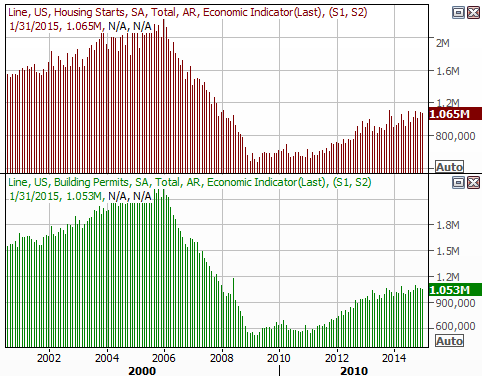
Source: Thomson Reuters Eikon
Though it's not quite is meaningful as the consumer inflation rate, January's producer price inflation rate was once again a bit discouraging. On a month-to-month basis it fell 0.8% overall, and slipped 0.1% on a core basis. Perhaps more important, the annualized PPI rate has now barely slipped into negative territory... deflation. We won't get January's CPI data until later this week, but generally speaking, it mirrors the PPI data.
Inflation Rates (Annualized) Chart
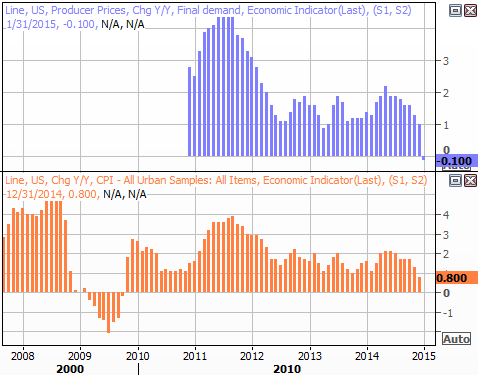
Source: Thomson Reuters Eikon
The ultra-strong U.S. dollar (UUP) is the bulk of the reason we're dancing with deflation at this point in time.
Last but not least, we got last month's industrial production and capacity utilization figures from the Federal Reserve on Wednesday. They were ok. Although capacity utilization slipped a little in January, both sets of data remain in bigger-picture uptrends.
Capacity Utilization and Industrial Productivity Chart
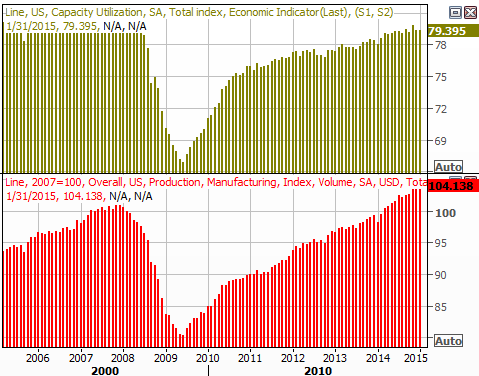
Source: Thomson Reuters Eikon
Economic Calendar
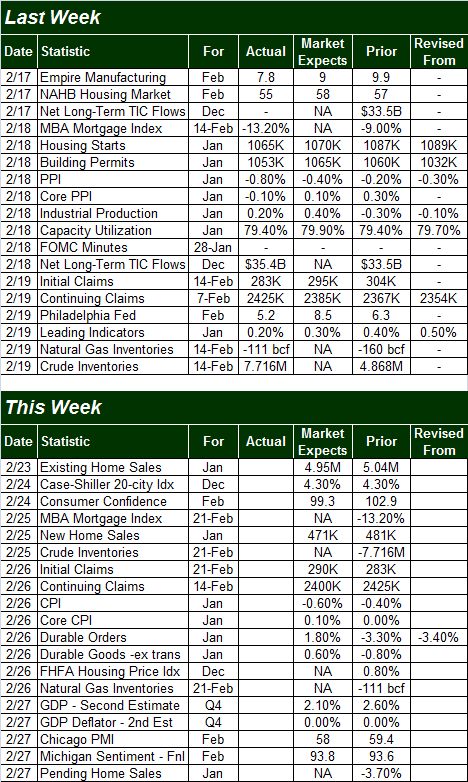
Source: Briefing.com
The coming week is going to be just as busy, especially for real estate data. Existing home sales, the Case-Shiller index, new home sales, and the FHFA housing price index are all in the lineup. All have been broadly positive of late, and are expected to remain reasonably strong for January.
Consumer inflation data for last month will be announced on Thursday; the pros are looking for more tepidness there.
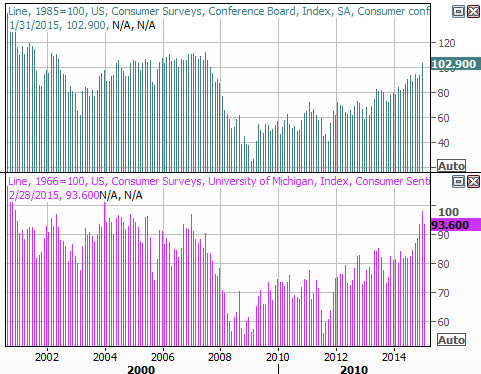
And, last but not least, it's going to be a big week for consumer sentiment data, in that we'll not only get February's consumer confidence score from the Conference Board, but will also hear the third and final reading for this month's Michigan Sentiment Index. The Michigan Sentiment score is on track to close lower than January's final score, and economists expect a lull from the Conference Board's measure of consumer confidence as well. But, both surged in January; a dip this month isn't a cause for major concern. Each is moving higher quite nicely.
Consumer Sentiment Chart
Source: Thomson Reuters Eikon
Stock Market Index Analysis
The merits and potential longevity of last week's bullishness are certainly debatable, but what's not up for (much) debate is that last week's upward thrust was indeed a technical breakout. Major prior ceilings have been hurdled, and the bulls finished up the week accelerating rather than decelerating. While this is clear on most charts, it's most clear - and most decisive - on the daily chart of the NASDAQ Composite (COMP) (QQQ). The NASDAQ has logged eight winning days in a row, and cleared the resistance level at 4809 more than a week ago; last week was spent just putting some distance between itself and that ceiling. Nasdaq Volatility Index (VXN) is also on the chart below.
NASDAQ Composite & VXN - Daily Chart
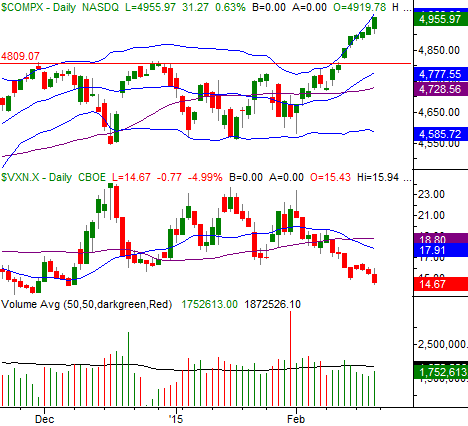
Chart created with TradeStation
The S&P 500's chart tells the same basic story, although it's not as deep into new-high territory as the NASDAQ is. But, there is something worth highlighting about the S&P 500's chart. Remember the Percent R confirmation we discussed last week, which is simply a renewal of the Percent R line's uptrend that occurs above the 80 level at the same time the S&P 500 itself makes a higher high? We got one on Friday.
S&P 500 & VIX - Daily Chart
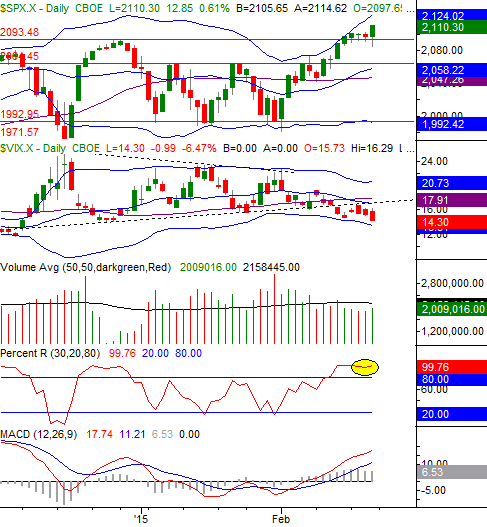
Chart created with TradeStation
Between that and the way the CBOE Volatility Index (VIX) (VXX) seems to have developed a new downtrend, the bullish evidence is rather convincing. The clincher is the Russell 2000 Index (RUT) (IWM).
One of the more significant problems with any of the recent flashes of bullishness was that small caps - which generally lead the market up as well as down - didn't participate in the effort. We can no longer say this. The Russell 2000 set up shop above a ceiling at 1190 two weeks ago, and pushed deeper into new-high territory last week.
Russell 2000 - Daily Chart
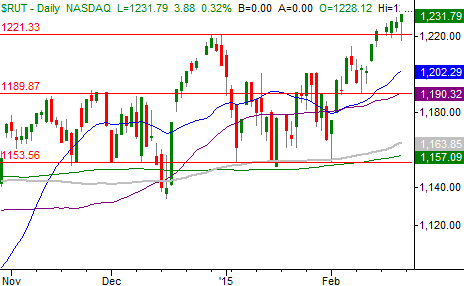
Chart created with TradeStation
This isn't to say all stocks and therefore indices (DIA) are going to proceed higher in a straight line from here forever. In fact, regardless of the quality of the breakout, we're at a point where we should expect a little profit-taking pressure. The hard work has been done by the bulls though. The key will be how well and how quickly stocks snap back from their first real bearish challenge.
Either way, the bigger-picture momentum is bullish until clearly proven otherwise. "Otherwise" would be best defined by breaks under the 20-day moving average lines, and more than that, by breaks under the 50-day moving average lines
Crude Oil is Still in the Hunt
Last week wasn't a particularly impressive one for crude oil (USO), it fell 5% to close around $50.80 per barrel. It's still too soon to assume oil is back in a downtrend though. As our chart below illustrates, crude is finding a pretty good floor at its 20-day moving average line (blue), and perhaps more important, last week's selling volume was notably lighter than the volume we saw on the way up between late January and mid-February. It's a clue that though oil is in a soft patch right now, the majority of the crowd may still be bullish.
Crude Oil (continuous contracts) Chart
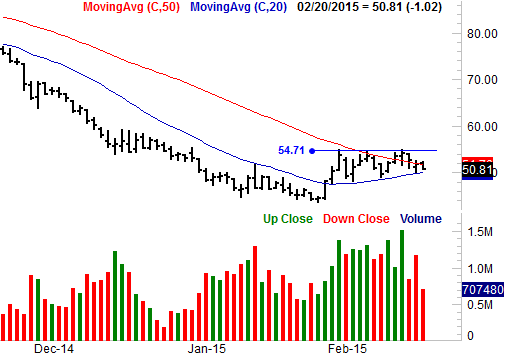
Chart created with TradeStation
Whatever the case, the big line in the sand for crude oil remains at $54.70.
Trade Well,
Price Headley
BigTrends.com
1-800-244-8736