
One of the toughest parts about being new (or even a veteran) to the world of options trading is picking the right one. There are an overwhelming number of choices, in terms of strike prices and expiration dates, and each one of those options has a unique risk/reward profile. It doesn't have to be as difficult as it seems, though. Indeed, any trader can and should keep things simple.
With that as a backdrop, here's an approach anyone can use when trying to determine the best call or put to trade. Many experienced traders are already doing these things -- at least mentally -- before the pull the trigger, even though they may not realize they're doing it.
Start With the Chart
It goes without saying the intent to purchase a call option means you think that stock (or index) is headed higher. Or, conversely, one would buy a put in anticipation of a decline in the value of the underlying instrument. A chart can tell you so much more though. Namely, a chart can give you great insight as to the length of time a trade may last, and how far it might move during that span.
How's that? History, for one, though every chart (regardless of its timeframe) serves up some sort of technical clues as to the likely time and distance of a move. Let's use 3M (MMM) to illustrate how we might do this.
Based on the current shape of the chart - an arched rollover - we have good reason to think 3M shares are at the beginning of a major pullback following a pretty big runup. Our search for a downside target suggests the former ceiling at $179.96 could be worth noting, but a closer inspection of the chart reveals the 200-day moving average line (green) has been a decisive floor the last two times it was tested. That could be a floor as well.
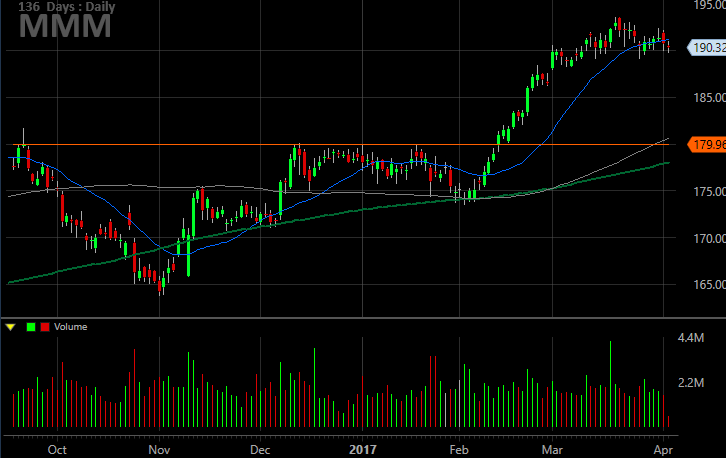
Here's the thing... the 200-day moving average line is rising. It could be right around the $179.96 level by the time MMM can get back to that area. So, though we don't have to use a "that or nothing" mentality with that value as a target, it's a great starting point.
As for time, based on the speed of the February runup and the pace of September/October pullback, we can estimate that any pullback from 3M here would last about a month and a half before reaching our target/floor.
Based on that eyeball view, we now know MMM is positioned for a 10-point move lower that will likely stop sometime around six weeks from now. Armed with that information, we can start weighing the upsides and downsides of all of our different put options.
Compare All Options in All Scenarios
Just for the sake of simplicity, let's assume we're buying conventional "third Friday" options that will expire on the third Friday of the coming month. That will give is right around six weeks of time to get to where we expect 3M to go. That will eliminate the expiration date analysis, allowing us to compare the different strike prices for this scenario.
You probably already know it, but the deeper in the money an option is, the more it costs, but the safer it is. The less in the money (or out of the money) an option is, the cheaper it is, but the riskier that trade becomes. The key is to find the optimal risk/reward balance, but to do that, we have to look at all the upside and the downside scenarios.
This isn't a tough one to make, as there are only three options that we really care about. Those are, the 190 puts that expire in 46 days, the out-of-the-money 185 puts that expire at the same time, and the 195 puts with the same expiration. The 190 puts cost $4.20 (or $420 per contract), which is quite a bit considering MMM shares are trading at $190.24. The 185 puts are much cheaper at $2.40, but they should be cheap -- they're technically worth nothing right now. Or, the least-risky 195 puts are selling for $7.20 (or $720 per contract) at this time. They're expensive, but maybe they're worth it. We'll see.
If 3M does end up falling to the $180 area, the 190 puts will be worth $10.00 (or $1000 per contract), up 138% from its entry price. At that price, the 185 puts will swing from being out of the money and into the money by $5.00, and be worth $5.00 each. That would be a 108% gain for that position. As for the 195 puts, they'd be worth $15.00 (or $1500 per contract), up 108% as well.
Surprised? Most traders would expect the cheaper, out-of-the-money 185 puts to be the big winners in this scenario, but they're not. It was the at-the-money 190 puts that ended up being the big winner.
Look at the Downside Too
There's a downside, of course. If at the end of a few weeks [you don't even need to go all the way to the end of the six-week timeframe] MMM shares are still at $190, the value of the 185 puts will be less than a third of their original value, the 190 puts will be cut in half -- if not more -- while the 195 puts will still be worth roughly $6.00 until the last week before expiration.
With that data in hand, traders have good reason to start rethinking things. From a risk/reward perspective, the most expensive puts -- the 195 puts -- are the best bet.
Putting it All Together
This isn't to suggest the at-the-money strikes are always the optimal risk/reward choice. They were in this case because the expected move was big, and there was some time to get there. If the timeframe is only a few days or the intended target isn't too far away, out-of-the-money options offer a lot of reward... albeit with an uncomfortable amount of risk. Generally speaking, the bigger and longer the intended move, the more those deeper in-the-money long-term options pay off compared to other choices. Thing is, you never really know the risk/reward scenario until you crunch the numbers.
If the idea of doing all this math for every trade seems exhausting, don't worry - not even the professional trading veterans crunch the numbers every time. After a while (and not even a long while) they can do it by "feel." If you're just learning though, it's not a bad idea to walk yourself through all the potential scenarios. You might be surprised what ends up being the optimal trade.
Of course, it can't be stressed enough.... it all starts with establishing a time and distance target on the chart.