Not The Perfect Bullish Breakout, But - Weekly Market Outlook
Not The Perfect Bullish Breakout, But - Weekly Market Outlook
The S&P 500 Index (SPX) (SPY) hit a new record high last week and the close of 2117.69 was the highest close we've ever seen from the index -- and the NASDAQ Composite's (COMP) (QQQ) close of 5092.08 was above the recent ceiling around 5044. The overall technical analysis picture is bullish for stocks. But, we can't ignore the fact that there have been multiple bullish runs over recent months that looked on the verge of a clear upside breakout only to reverse lower -- and can't dismiss the possibility that the market is again aiming to lure a bunch of investors in, only to lower the boom when it's least expected.
We'll weigh the odds below, after taking a quick look at last week's and this week's major economic news.
Economic Data
It was actually a rather light week last week in terms of economic data, but we did get two biggies.... home sales, and durable orders, both for March.
On the home sales front, though new homes sales fell from a pace of 543,000 to only 481,000, existing home sales edged higher from a pace of 4.89 million to 5.19 million. That 300,000 upswing in existing home sales more than offsets the lull in new home sales. Though last month's data wasn't encouraging, the overall trend still bodes well for homebuilders.
New and Existing Home Sales, Annualized Chart
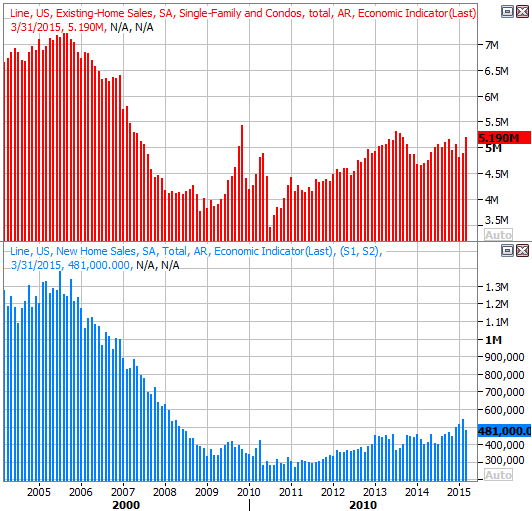
Source: Thomson Reuters Eikon
As for durable orders, the overall increase of 4.0% last month was entirely the result of always-volatile transportation orders (planes, trains, and automobiles). Excluding transportation orders, durable orders actually fell 0.2% in March. That's the sixth straight month of period-over-period declines in ex-transportation orders, which also happens to be the longest streak of period-over-period declines since 2008.
Durable Orders Growth Chart
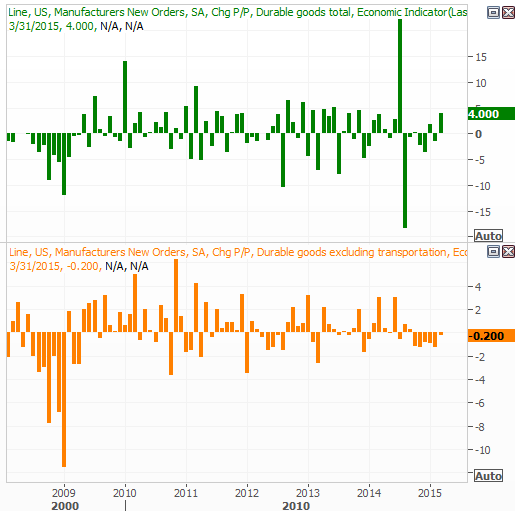
Source: Thomson Reuters Eikon
Everything else is on the following grid:
Economic Calendar
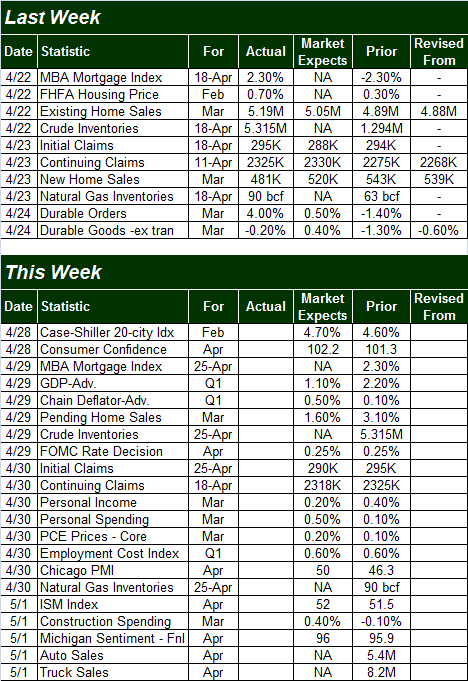
Source: Briefing.com
The coming week is going to be considerably busier, though there's not a lot of truly hard-hitting news in the lineup.
The biggest of these items is Wednesday's interest rate decision from the Federal Reserve. It's unlikely any changes will be made to the Fed Funds Rate, though the language used to tell investors that will once again be very telling in itself.
It's also going to be a big week for consumer sentiment data. We'll hear the Conference Board's consumer confidence reading for April on Tuesday, and we'll get the third and final Michigan Sentiment reading for April on Friday. Both have been trending higher since 2009, and forecasters expect more of the same this time around.
Consumer Sentiment Trends Chart
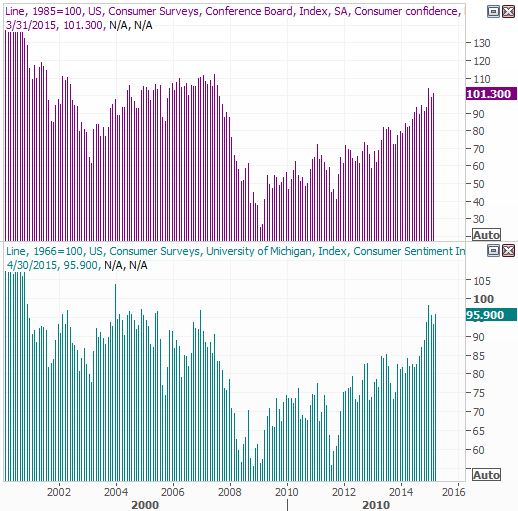
Source: Thomson Reuters Eikon
Stock Market Index Analysis
The best place to start this week's analysis and outlook is with the beginning, with a look at exactly what happened - and what didn't happen - last week. It must be acknowledgement that the bulls finished the week with a strong technical hold on stocks, and don't have many hurdles to go before forming about as perfect of a breakout as one could expect (although the "perfect breakout" could be a warning sign of sort - read on).
As our daily chart of the S&P 500 shows, the index cleared the minor, falling (dashed) resistance line on Thursday and then followed through on Friday. The VIX also broke under a pretty significant support level around 12.7. At the same time not only is our Percent R indicator now in bullish territory by virtue of being above the 80 level, the MACD lines have renewed their upward move.
S&P 500 & VIX - Daily Chart
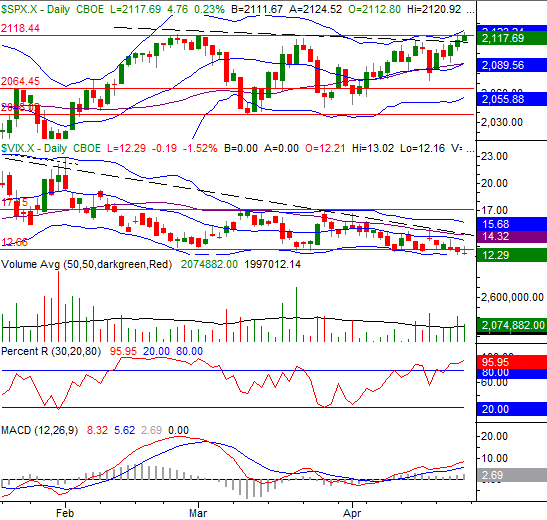
Chart created with TradeStation
It's about as ideal as it gets, on the surface. The only shortcoming the bears could use to argue their case would be the fact that the S&P 500 hasn't pushed its way above the ceiling around 2118. Even then, however, the market's current momentum suggests this key technical leap could materialize early this week.
The NASDAQ also did decidedly clear its comparable hurdle at 5044. Inasmuch as the NASDAQ leads the overall market higher and lower, the bullish case is bolstered by the NASDAQ's daily chart.
NASDAQ Composite & VXN - Daily Chart
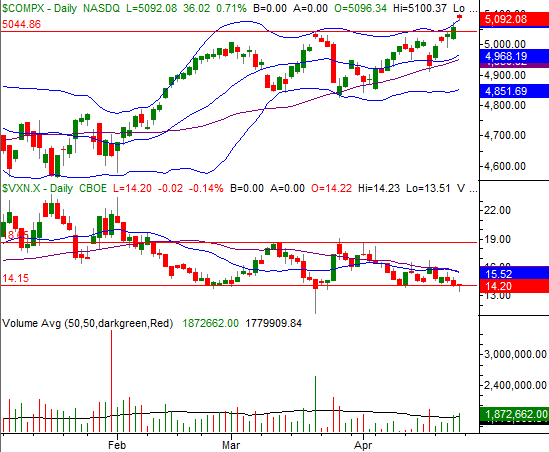
Chart created with TradeStation
The only concern with the Nasdaq Composite chart is the Nasdaq Volatility Index (VXN). It didn't break under its floor at 14.1. It tries to do so on Friday, but by the time the closing bell rang it drifted back up to that floor. If the Nasdaq Comp is to be able to make meaningful progress from here, the VXN will likely need to be able to move lower.
Zooming out to a weekly chart of the COMP we can get a much better feel for why we may want to be a bit concerned. It's in this timeframe we can tell the composite is once again bumping into a key resistance level (red) that extends all the way back to mid-2014. We can also see on this chart the VXN, although it can move lower, is all too familiar with a floor at 14.1. Even if that floor should break though, there's another one waiting for it at 12.8. The best we can hope for with the VXN already this low is a choppy, grinding rally like we saw in 2013 (although even that period was a fruitful one for stocks).
NASDAQ Composite & VXN - Weekly Chart
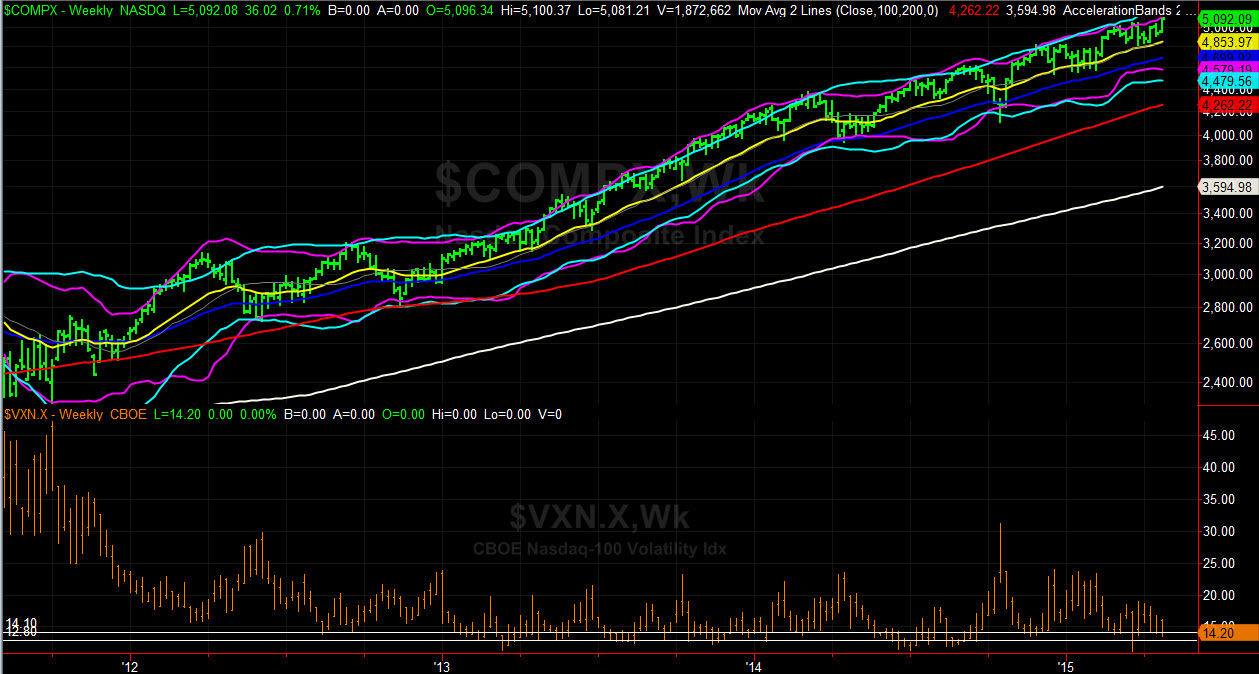
Chart created with TradeStation
Even so, the weekly chart of the S&P 500 technically offers more reason for bullish hope than bearish despair. It's in this timeframe we can see the support at the 26-week moving average line (at 2064) is still well intact, and on the verge of driving the index beyond the 2118 mark... which would be catalytic. It's also on the weekly chart of the S&P 500 we can see the VIX - after its slight break under 12.4 - has some room to work with before reaching its next key support level around 10.0.
S&P 500 & VIX - Weekly Chart
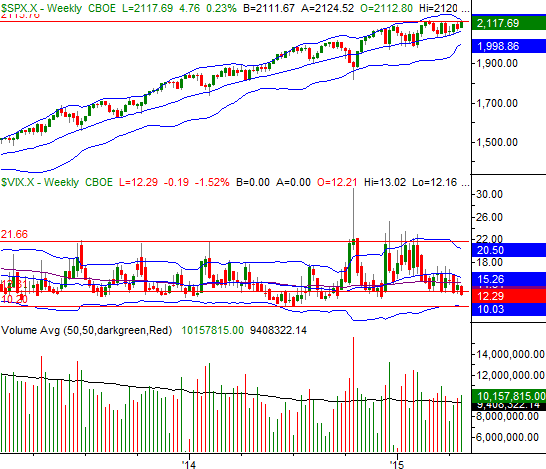
Chart created with TradeStation
It's admittedly not the ideal breakout situation. This kind of uninterrupted bullish persistence is the sort of thing one can expect in the early stages of a new bull market. Here in the latter stages of a bull trend though, with valuations getting more than a little frothy, it becomes much easier for breakout efforts to fail before they get started.
Be that as it may, the trend is your friend, and we have to trade the trend as we see it until we clearly can't. The current momentum as well as last week's partial and full breakouts suggest more upside is ahead. In fact, the tide won't decidedly turn in the other direction until/unless the S&P 500 breaks under the 2090 level, where the 20-day and 50-day moving average lines have converged.
Trade Well,
Price Headley
BigTrends.com
1-800-244-8736