Nasdaq Hits Multi-Year Highs Amid A Risky Environment - Weekly Market Outlook
Nasdaq Hits Multi-Year Highs Amid A Risky Environment - Weekly Market Outlook
It may have been a volatile mess, and even with a strong finish, the broad market still closed in the red for the week (though just barely). Yet, the bulls managed to evade a meltdown when it mattered the most, and may well have rekindled the uptrend.
There's still the massive hurdle of wildly high valuations, mind you, so any rally isn't likely to be a long-lived one. It's clear, however, that just because the market's overdue for a dip doesn't mean we're guaranteed to see it soon.
We'll look at the ins and outs of the rally in a second. The first thing we need to cross off the to-do list is painting the bigger picture with the broad brush strokes of last week's major economic data.
Economic Data
Last week was a big one for real estate and construction, with lots of data regarding home prices and sales activity. And, it was all pretty good. The Case-Shiller home price index said the average home value was up 10.8% on a year-over-year basis for April, and though the FHFA said housing prices didn't budge in April from March's values, they were still up 6.0% versus April-2013's levels.
Home Price Trends Chart
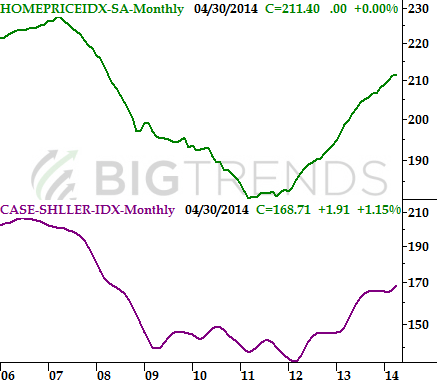
Source: Standard & Poors and FHFA
People were buying more houses too. The National Association of Realtors reported existing homes sales at a pace 4.89 million for May... the best pace since October of 2013. Meanwhile, the FHFA estimated new home sales hit an annualized pace of 504,000 units in May. That's the highest reading since early 2008, and even if the scope of the surge was a fluke, the fact that new home sales were up is still an encouraging sign.
Home Sales Trends Chart
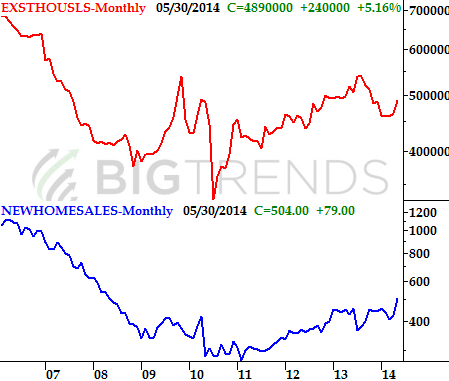
Source: Census Bureau and National Assn. Of Realtors
On the confidence front, things are looking healthy. The Conference Board's consumer confidence reading for June hit a multi-year high of 85.2. The final reading for June's Michigan Sentiment score didn't hit a multi-year peak, it's also still in a solid uptrend. Though improving sentiment doesn't help prevent short-term pullbacks, it's a bullish sign for the longer-term market trend.
Consumer Sentiment Trends Chart
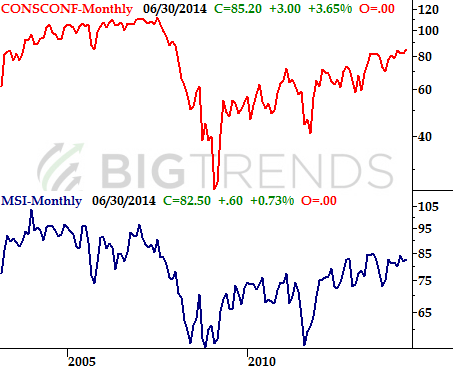
Source: Reuters and Conference Board
Last but certainly not least, Q1's GDP was even worse that first expected. The third and final estimate for the first quarter's gross domestic product change was an ugly -2.9%. Much of the blame for the sharp decline can be blamed on weather. Whatever the reason, however, it's unlikely to be a lingering problem... even if investors are possibly expecting too much from the market in the foreseeable future.
Economic Calendar
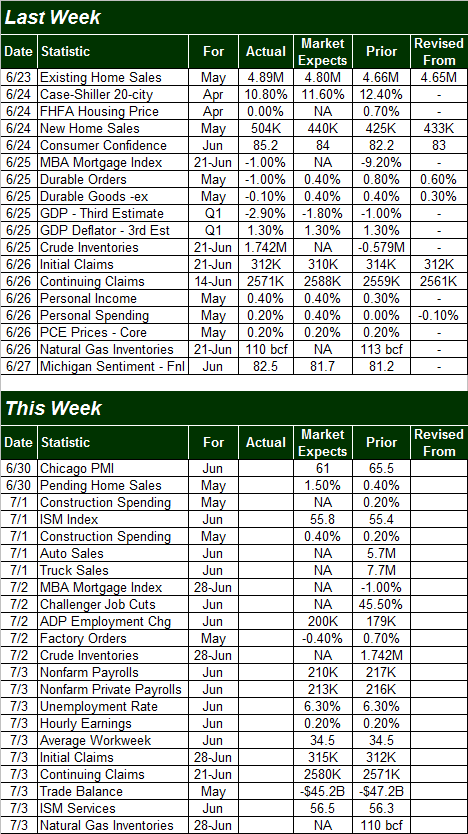
Source: Briefing.com
The coming shortened trading week is crammed pretty full of economic numbers, though the only important data nuggets won't be unveiled until Thursday when we get June's employment report from the Department of Labor. The DOL believes the unemployment rate will remain at 6.3% on the heels of adding 213,000 new jobs. That could be considered progress, but we'll need new payrolls at a pace of 300,000 or more to really move the dial on the unemployment rate.
Stock Market Index Analysis
Just so there's no misunderstanding, it would take very little for this fragile market to be up-ended here. Complacency is dangerously high, as are valuations. As long as the bulls don't push their luck and we don't get any dire news, there could be some - though not a lot - of life left in the uptrend. Until and unless we snap some major support levels, however, stocks can remain in their unlikely uptrend. With that as the backdrop...
The market definitely showed its vulnerability last week, with drastic pullbacks on Tuesday and Thursday. Take a close look at what happened on Thursday to the S&P 500 (SPX) (SPY) though. All it took was a brush of the 20-day moving average line (a key support and resistance level) and the rally restarted itself.
S&P 500 & VIX - Daily Chart
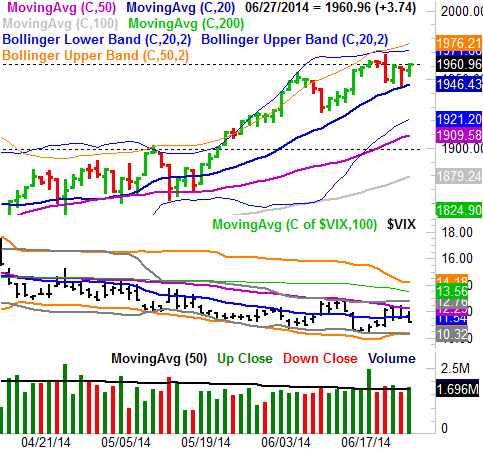
All charts created with TradeStation
Was this enough to put the index back into the uptrend it was over the better part of May? Possibly. It sure looks that way. The problem with the premise becomes one of longevity. While there was some room for upside at the beginning of May, here at 1960.96 there's not much room at all left for advancement. The CBOE Volatility Index (VIX) (VXX) is almost back to a major floor at 10.3 - where both of its lower band lines have converged - and as of Friday the S&P 500's trailing P/E is a frothy 17.5 (based on Q2's earnings estimates). It's tough to imagine the market justifying a higher valuation, even if the forward-looking P/E (starting with Q3's estimates) of 15.25.
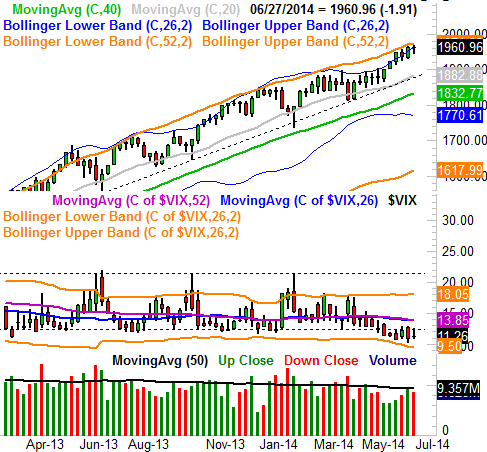
Not much changes when we zoom out to a weekly chart of the S&P 500, though we can see just how far we've come in this timeframe, and why the rally may be nearing exhaustion. We can also see just how unusually low the VIX is here.
S&P 500 & VIX - Weekly Chart
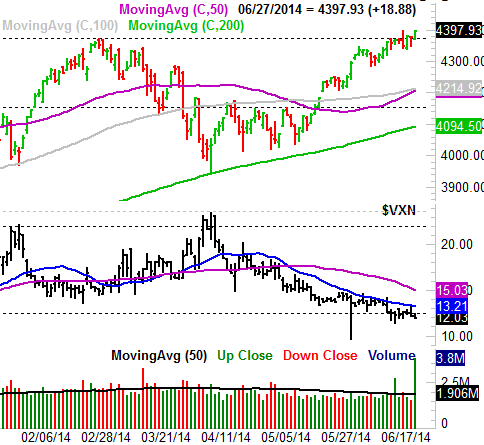
So stocks are destined for a decline, even if they need to move just a tad higher first? Maybe, but something curious developed last week - and on Friday in particular - that says the momentum may be a little stronger than it feels like it should be. The NASDAQ Composite (COMP) (QQQ) punched through a major ceiling at 4372 to close at its highest level in years. If the bulls weren't for real, they wouldn't have worked so long and so hard to break through that resistance.
NASDAQ Composite & VXN - Daily Chart
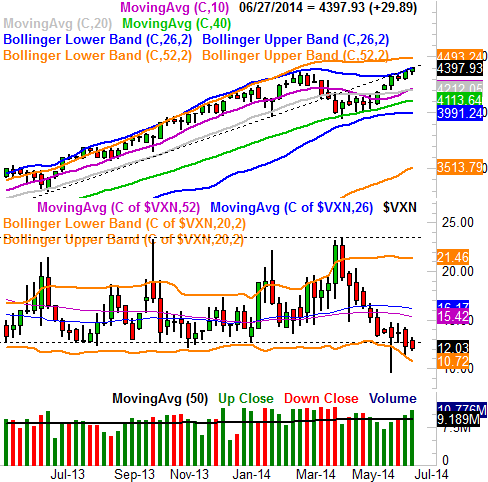
The weekly chart of the NASDAQ Composite doesn't show us anything new, but we can see in the weekly timeframe just how uncomfortably low the VXN has gotten.
NASDAQ Composite & VXN - Weekly Chart
So what's the call? This is admittedly a tough situation. The momentum is bullish, but clearly there's a glass ceiling right above where we are. As difficult as it may be to get bullish, we have to assume the trend currently in motion will remain in motion until it's clear the uptrend has been snapped. A key clue to that breakdown will be the S&P 500's break under the 20-day moving average line along with the VIX cracking the ceiling at 12.8. Anything less, and we can just chalk it up to a little volatility. Just know that any bullishness is still going to be relatively short-lived before the next hurdle is encountered. For the S&P 500, that's a zone between 1970 and 2000.
Trade Well,
Price Headley
BigTrends.com
1-800-244-8736