Morning Star vs Death Cross - Weekly Market Outlook
Morning Star vs Death Cross - Weekly Market Outlook
Talk about a reversal of fortune! By mid-day Thursday it looked like stocks were finally falling off of a cliff they'd been dangling from for weeks. By the end of the day Friday, the bulls were back in charge, although they're still on the wrong side of the market's key make-or-break lines.
Technically speaking, the onus is still on the bulls to prove they're in charge, while the bears can let the bigger-picture momentum do their talking. On the other hand, as close as the market is to hurdling its key resistance levels, we must dissect the arguments being made from both sides of the table.... which we'll do, right after a quick look at last week's major economic announcements.
Economic Data
While there was a truckload of economic news posted last week, all of it paled in comparison to Friday's update on the current employment (or lack thereof) numbers. Let's start there, with the overarching data - the unemployment rate fell from 6.1% to 5.9%, and the number of new jobs created reached 248,000. It was good news, though not necessarily as good as those two numbers were touted as being.
For the record, the total number of people with jobs increased by roughly 200,000 people, reaching 146.6 million. Conversely, the number of officially unemployed people fell by about 300,000, to 9.26 million. So, the payroll-creation figure is on target. Still, the actual unemployment rate dip may have been a bit exaggerated by the fact that the total labor force [the figure used as the denominator in the unemployment rate calculation] somehow fell by nearly 100,000 people. The number of people who want jobs but are no longer counted as unemployed also grew, by about 50,000. Adjusting for those changes, the actually unemployment rate would have actually only fallen to 6.0%. Still, any progress at all is progress, which is good for the long-term market.
Employment Data Trends Chart
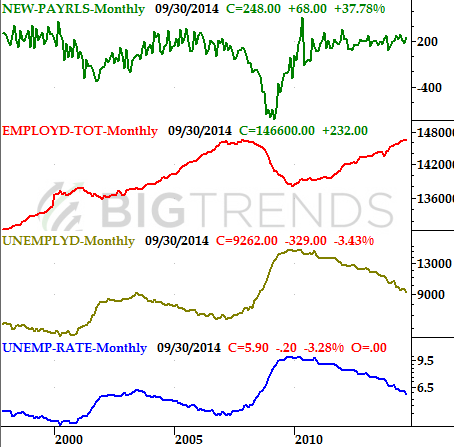
Source: Bureau of Labor Statistics and Department of Labor
The only other really meaningful economic data we got last week was September's consumer confidence score. It dropped more than a little. The Conference Board said September's confidence reading fell from 93.4 to 86.0. It's still in a bigger uptrend, but its something to watch closely when we get October's score late this month.
Just for the record, the Michigan Sentiment Index reading didn't drop in September. In fact, it advanced to a multi-year high of 84.6. Either way, both sentiment scores remain in long-term uptrends, which bodes bullishly or the long-term market trend.
Consumer Sentiment Chart
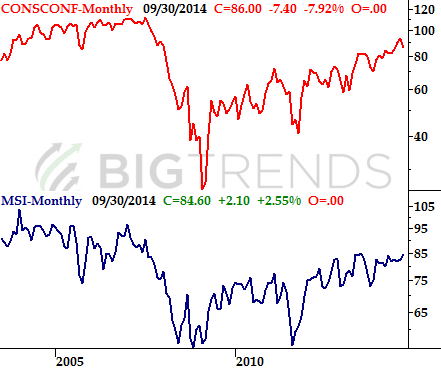
Source: Reuters and the Conference Board
Everything else is on the following table:
Economic Calendar
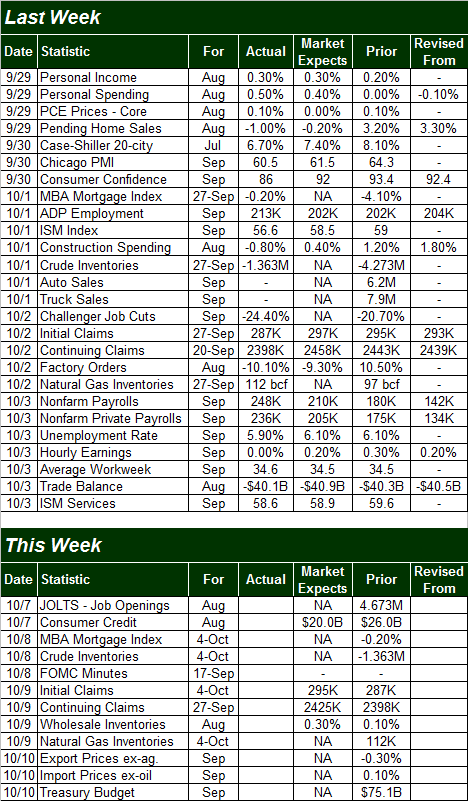
Source: Briefing.com
The coming week is going to be a light one in terms of economic numbers, and none of what little data we're getting is likely to be market-moving. In fact, we're not even going to preview any of it. Of course, it may not matter anyway. This week kicks off Q3 earnings season, so most eyes will be on the beginning of that flow of data. Alcoa (AA) gets the ball officially rolling on Wednesday, after the market closes.
Stock Market Index Analysis
In retrospect, Friday's big gain was the likely result of Thursday's intraday reversal effort.... a bar that started out where the market closed Wednesday, made a very deep low, and then rallied back to where it opened. Friday's advance was simply a follow-on to Thursday's turnaround. Perhaps more important, the pattern of bars left behind over the course of Wednesday, Thursday, and Friday makes up a key reversal clue that suggests more upside is in store.
We don't talk about candlestick analysis much, but when it's merited, we will. As it just so happens, it's merited now.
Ever heard of a "Morning Star" Japanese Candlestick pattern? It's a pattern that requires three bars (three days, in this case) to form. The first bar is a tall bearish bar, the second bar is a doji (where the open is essentially the same as the close), and the third bar is a tall bullish day. It's an indication that the momentum has decidedly shifted from a bearish one to a bullish one, with the middle of the second bar acting as the pivot from a net-bearish to a net-bullish environment. Well, Wednesday, Thursday, and Friday were almost a textbook example of a morning star, suggesting any lingering bearishness has been washed out and the bulls are taking over again. Take a look at the S&P 500 (SPX) (SPY) to see:
S&P 500 & VIX - Daily Chart
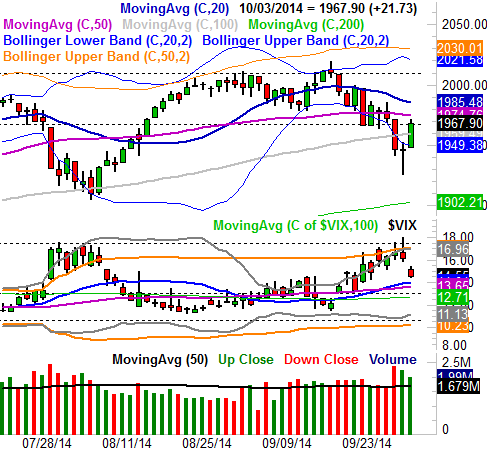
All charts created with TradeStation
So the near-term outlook is now bullish? Not just yet.
Although this isn't a chart to be dismissed, at this point it wouldn't hurt to wait and see if the S&P 500 can make it back above its 50-day moving average line at 1975 (and for that matter, back above the 20-day moving average line at 1985) to become fully bullish. The index could do so in two or less days, and if the morning star clue is the real deal, the resulting rally should be much longer and much bigger than that.
There are problems with the bullish thesis above and beyond the index being stuck under the key short-term moving average lines, however. Another problem is the sizeable gap the CBOE Volatility Index (VIX) (VXX) left behind when the market opened Friday. The VIX doesn't like to leave unfilled gaps behind any more than the S&P 500 or any other index or stock chart likes to leave them behind, so there's going to be upward pressure on the VIX this week. That, in turn, will apply bearish pressure on the stock market.
In other words, we're on hold here, which is appropriate given the BigTrends TrendScore for stocks was last seen in neutral territory (between 40 and 60). Yet, there's still something of an ace in the hole we can watch for.
While the S&P 500 - and the NASDAQ Composite (COMP) (QQQ) and the DJIA (INDU) (DIA) for that matter - still offers a good degree of hope for a quick rebound, the Russell 2000 (RUT) (IWM) is still a major concern. It matters, because the Russell 2000 tends to lead the market both higher and lower. If it deteriorates first, the rest of the market can't be far behind.
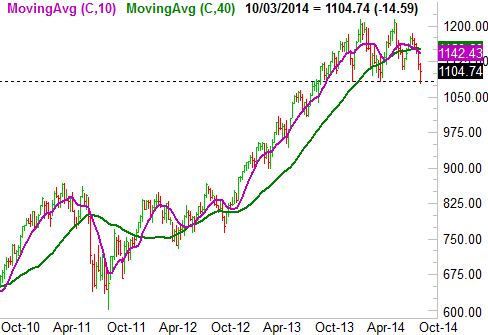
To that end, take a look at a weekly chart of the Russell 2000. Unlike the other market indices, the Russell 2000 has already logged a major lower high, and if it breaks under 1083, that's going to be the first major lower low since 2011. Also alarming is how the 50-day moving average line has crossed under the 200-day moving average line - the so-called 'Death Cross' that has received a lot of media attention (although recent Russell 2k Death Crosses haven't actually been bearish).
Russell 2000 - Weekly Chart
Again, it's too soon to assume the worst. It's not too soon to acknowledge the possibility, however, that worse could materialize without warning this week. We'll take the TrendScore at face value and remain neutral for now, but one way or another a bigger move is brewing, and it should start this week.
Trade Well,
Price Headley
BigTrends.com
1-800-244-8736