Let The Dust Settle Here - Weekly Market Outlook
Let The Dust Settle Here - Weekly Market Outlook
To say last week was a rough one for the market would be an understatement. It was the biggest weekly loss we've seen since 2012, and perhaps worse than that, it really got traders wondering if stocks are far more vulnerable than they may have first thought. And sometimes, that doubt can be more dangerous than any technical or fundamental problems the market may be facing.
We'll dissect all of it below, beginning with our usual look at key economic numbers.
Economic Calendar
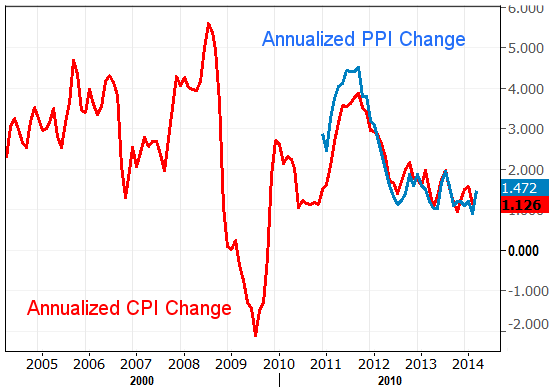
As we mentioned last week, there wasn't much in the economic data lineup last week, and little of that was important. The only thing that was of any real interest was Friday's producer price inflation. We're finally seeing some much-needed inflationary pressure; as of last month the annualized producer inflation rate stands at 1.4%. It's a small hint that there's finally some pricing power - a hint of economic strength - for suppliers and manufacturers (yet it's not at debilitating levels - it's at a healthy balance). The picture will be completed this week when we get the consumer inflation data, though the feeling is that it too will show a modest perk-up towards healthier levels.
Inflation Trends Chart
Source: Bureau of Labor Statistics
Economic Calendar
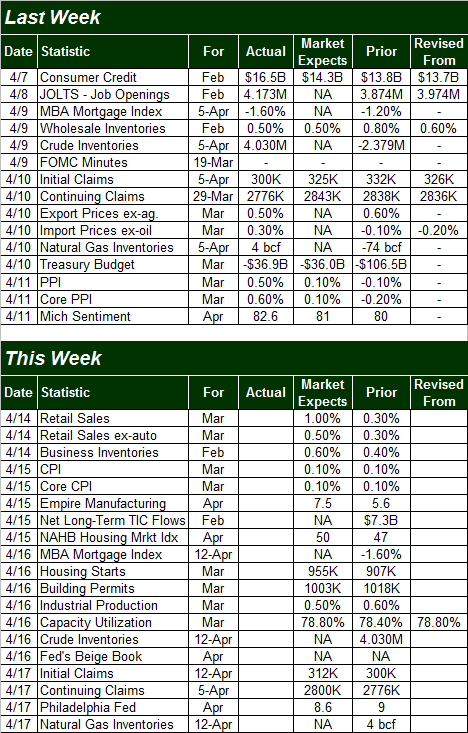
Source: Briefing.com.
You can see that this week will be a little busier this month, with a handful of these items capable of moving the market ... IF traders can look past the panic selling that may continue after Thursday's and Friday's meltdown.
The fireworks start on Monday morning, with March's retail sales. The pros are looking for some noteworthy strength here too, with spending expected to be up 0.5% without cars, and up a solid 1.0% when factoring automobiles into the equations. As you can see on the chart of year-over-year changes in retail spending below, we're still in net-positive territory here, but it's not strong annualized growth.
Retail Spending, YOY Change Chart
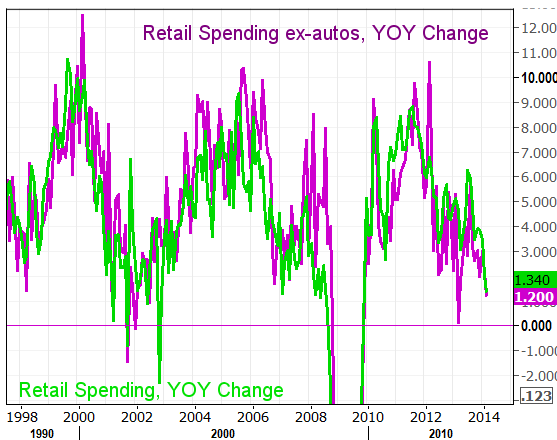
Source: Thomson Reuters
The inflation picture will be rounded out on Tuesday when we get last month's consumer inflation data. Though there was a glimmer of better pricing power last month from the producer price inflation data, economists aren't looking for any big improvement here for March. The annualized inflation rate (consumer inflation) now stands at 1.13%, down from January's 1.58%. That's pretty low, yet it's not apt to make any significant progress this time around. We really need an inflation rate of about 2.0% - if not a little more - to say we're in a healthy and balanced economy. [The CPI data appears above with the PPI data.]
On Wednesday we'll hear about March's housing starts and building permits. This has been something of a sore spot for the past several months, and it doesn't look like March is going to show us any real recovery from the real estate and construction market.
Real Estate Trends Chart
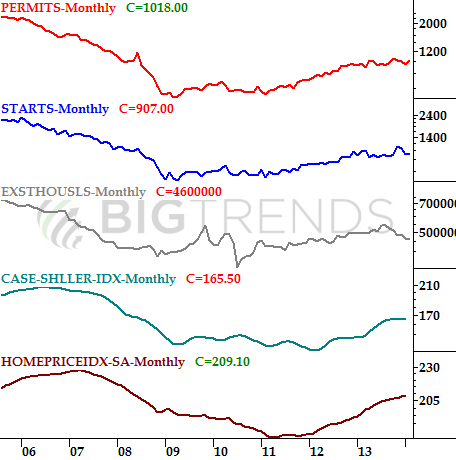
Source: Standard & Poor's, Census Bureau, and FHFA
We'll also be getting industrial production and capacity utilization numbers on Wednesday. Both are expected to be better in March than they were in February.
Just bear in mind that even good economic numbers or even earnings reports may be irrelevant this week in terms of doing anything to help the market rebound. And, if any economic numbers roll in worse than expected, investors could easily use that as an excuse to shed already-shaky stocks.
Stock Market Index Analysis
No need to mince words - stocks got rocked late last week, and some key lines were crossed... for the worst. Let's just dive in and look at those breakdowns before making any kind of guess.
First and foremost, since we brought it up a week ago, the NASDAQ Composite (COMP) (QQQ) did end up closing below its key 100-day moving average line (gray) last week. That's the first time that's happened since late 2012. The straightforward interpretation of this is bearish until further notice.
NASDAQ Composite - Daily Chart
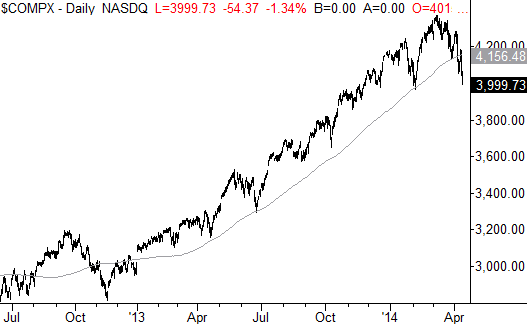
All charts created with TradeStation
The S&P 500 (SPX) (SPY) also broke under its 100-day moving average line too, though in the grand scheme of things that's not unusual for the S&P 500. On the other hand, the S&P 500 broke under a pretty important support level around 1841, and there's nothing left that would act as a natural technical floor for the index.
S&P 500 & VIX - Daily Chart
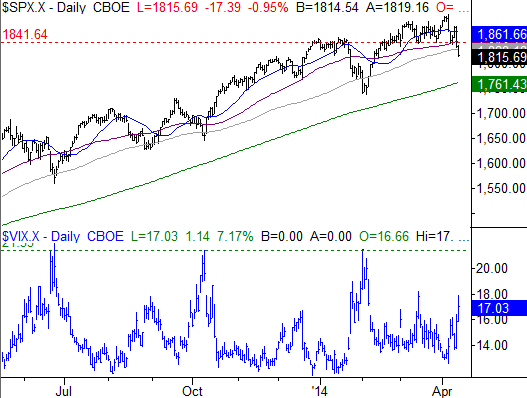
It's also worth noting that the CBOE Volatility Index (the VIX, or the Fear Index) (VXX) has also yet to reach a key level at 21.4, which is where it topped out the last two times the S&P 500 hit a major bottom and bounced back to hit higher highs.
So stocks haven't hit their near-term low yet? No necessarily.
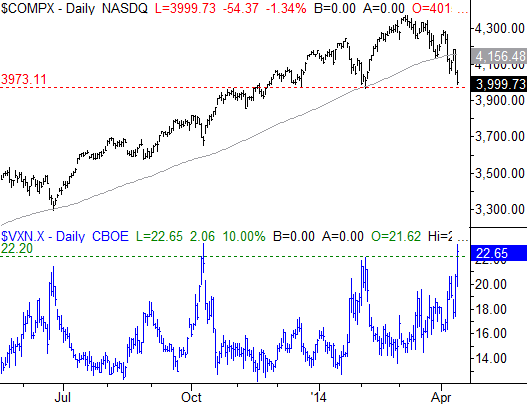
While the S&P 500 may not be at a key technical bottom and the VIX not yet at a key peak level, the NASDAQ Composite is pretty close to a key support area, and the VXN (the NASDAQ's Volatility Index) has already hit a peak level that tends to coincide with major short-term bottoms for stocks. Specifically, the VXN hit a high of 23.18 on Friday, more than topping the ceiling around 22.0 that was brushed the prior three times the composite hit a key low. And, though it only hit a low of 3991.63 on Friday, that low is pretty close to a major floor at 3973; one more stumble (and an intraday dip would do the trick) could clean up that last bit of distance between that big floor and where the NASDAQ is now, and invite the bulls to come roaring back in.
NASDAQ Composite & VXN - Daily Chart
So we're bullish? No, we can't say that with any great deal of conviction either. There's a perfectly good chance this pullback could be the one that finally does what the last several haven't, which is actually get some traction and pull the NASDAQ beneath 3973. If that happens, the odds of a "from bad to worse" rise exponentially. And for what it's worth, while the VXN has found a ceiling around 22.0 in recent months, the long-term ceiling for the VXN can easily exceed 30.0, if not 40.0. On that note...
While it's nothing that can be used to predict a significant pullback, this leg of the bull market has now gone 30 months without a correction of 10% or more. To be fair, rallies have lasted longer than that without a major correction, though no recent rallies have done so and also moved at the red hot pace this one has since October of 2011. It may not be a scientific prediction, but one has to wonder if this rally has pushed its luck a little too long.
Bottom line? Fair or not, the bears are technically in control, and the pressure is on the bulls to do something about it. Just don't react too quickly to the first sign of strength. The S&P 500 will need to move back above the 1841 level to even think about being bullish, and the NASDAQ will need to crawl back above the 100-day moving average line at 4156 for the scales to tip bullishly again... and even then there's no guarantee. The market could bounce a little early this week and still not truly snap itself back into an uptrend.
On the flipside, if we start to pull back again after any bullish pushback here - or of the NASDAQ breaks under 3973 and stays there - at that point traders are likely to throw in the towel and finally dole out that much bigger and long-overdue correction. In the meantime, the smart move may simply be to let the dust settle and see who shows their cards first.
Trade Well,
Price Headley
BigTrends.com
1-800-244-8736