Grinding Higher Economy & Stocks - Weekly Market Outlook
Grinding Higher Economy & Stocks - Weekly Market Outlook
As is usually the case, Thanksgiving week proved to be a rather tepid one for stocks, with most of the trading crowd choosing to check out around the middle of the week. Volume for last week as about half the norm. Nevertheless, where we left off on Friday is where we'll restart things on Monday, so it's still worth figuring out where we are and where we're likely to go from here for the broad stock market.
We'll do exactly that below and look at one interesting sector long-term setup, after a quick run-down of last week's economic numbers.
Economic Data
Despite the holiday break, we heard plenty of economic news last week. Some of it as good, and some it was less-than-compelling.
One of the encouraging data nuggets was the second estimate for Q3's GDP growth rate. Economists are now saying the economy grew at an annualized pace of 3.9%, versus the first estimate of 3.2%. There's one more possible revision to go, although it's rare to see a significant change between the second and third (final) estimates.
GDP Growth Chart
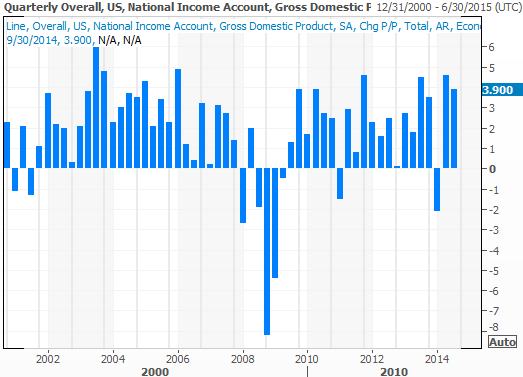
Source: Thomson Reuters Eikon
Everything else from last week was a bit of a mixed bag with a grinding growth undertone, even within the category of data in question. For instance, although the Michigan Sentiment Index score for November advanced from October's reading of 86.9 to a score of 88.8 for this month, the Conference Board's consumer confidence level fell from 94.1 to 88.7 for November.
Durable orders were a mixed bag too. Overall orders grew 0.4% last month, but when taking transportation orders out of the mix, durable goods orders actually fell 0.4%. [It's important to know that despite one month's stumble, the longer-term orders trend is still a positive one.]
The Case-Shiller Index indicated 4.9% growth (yoy) in home prices for September, while the FHFA Housing Price Index didn't budge for September (on a month-to-month basis). Both are still in uptrends, but the pace of progress is slowing.
Real Estate Price Trends Chart
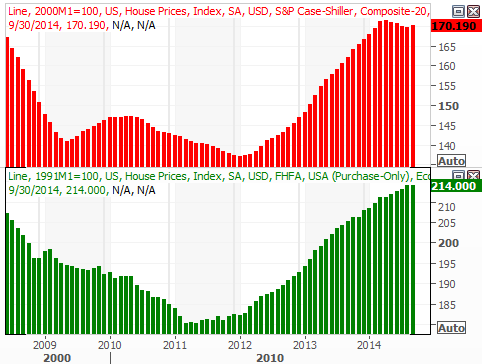
Source: Thomson Reuters Eikon
Finally, although pending home sales fell 1.1% for October, the annual pace of new home sales reached 458,000 units for October, up from September's pace of 455,000. New home sales continue to generally trend higher, though total pending home sales seem to be lethargic.
Home Sales Trends Chart
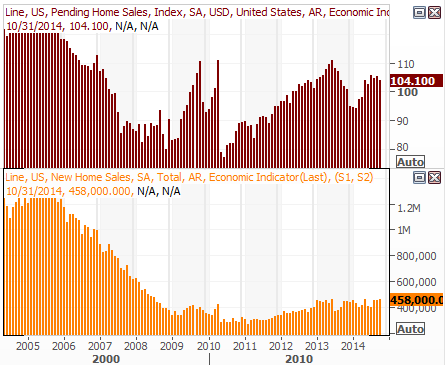
Source: Thomson Reuters Eikon
Economic Calendar
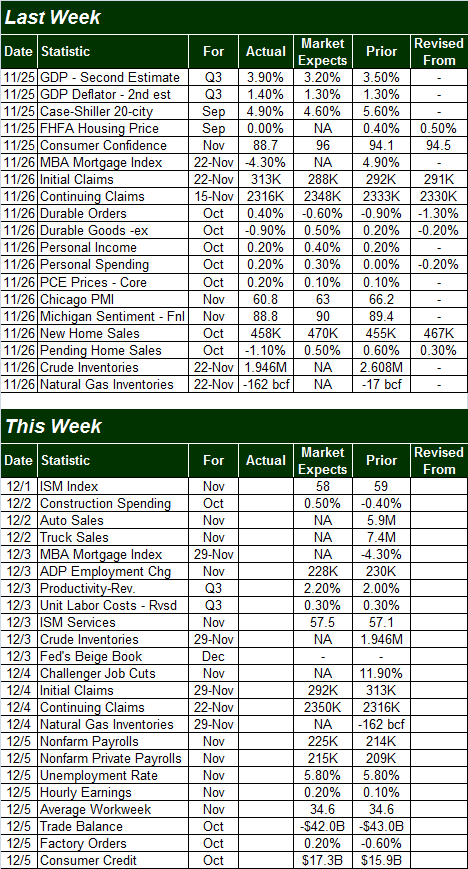
Source: Briefing.com.
Stock Market Index Analysis
This week's analysis is made trickier by virtue of last week's trading lull. We can't assume any hints dropped last week are iron-clad clues, as it was an unusual trading week. On the flipside, the market's going to pick up this week where it left off last week. So...
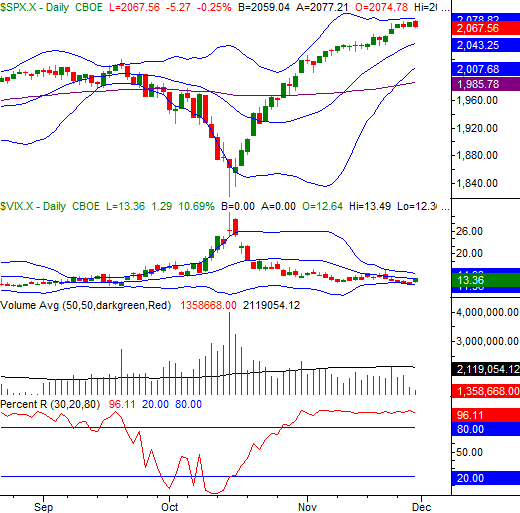
The momentum remains bullish, and the BigTrends TrendScore remains in the high 90's (out of 100). For no other reason we have to remain in the bullish camp. Yes, on Friday the S&P 500 (SPX) (SPY) opened higher and then closed at a lower low. In normal circumstances this would be something of a bearish red flag, and we'll certainly be watching things closely early this week. However, with the Percent R indicator (using the BigTrends smoothed out method) still in strong bullish territory and the CBOE Volatility Index (VIX) (VXX) still technically in a downtrend, we'll side with the current trend even if the situation seems overbought; stocks can get and stay overbought for weeks on end, rallying the whole time.
S&P 500 & VIX - Daily Chart
All charts created with TradeStation
When we zoom out to a weekly chart we gain some more perspective on the current situation, regardless of last week's lull. It's in this timeframe we can see there's a little more room for the S&P 500 before bumping into a long-term, rising resistance level (red) currently at 2103. But, if the index can pace itself well, it may not necessarily bump into that line and risk a pullback until maybe the 2150 level. It's all about the timing.
S&P 500 & VIX - Weekly Chart
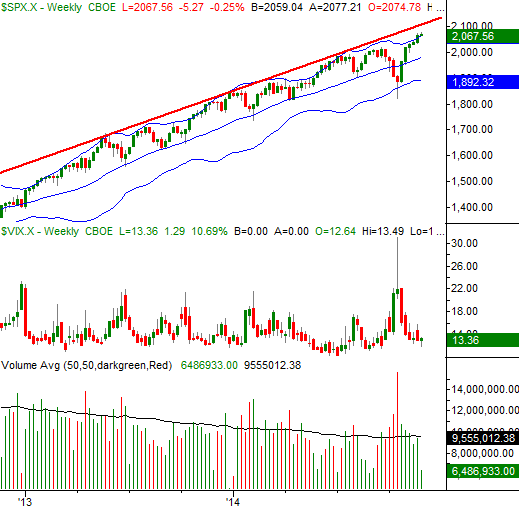
Yes, the S&P 500 bumped into its upper 26-week Bollinger band a couple of weeks ago, which is a potential ceiling. As you can see going all the way back to the beginning of 2013 though, the index has been more likely to push through the upper Bollinger band rather than be repelled by it. It's taken a brush with that major straight-line ceiling to send the market back-pedaling to any meaningful degree. That being said...
While the S&P 500's ceiling is at 2103 and rising, it should also be noted there's a floor currently at 1980, and also rising. It's the 26-week moving average, which with the exception of October's lull has stopped and reversed every major pullback since mid-2013. We'll place our mental support level there for the time being. That's a long-term floor, however. The short-term floor is still the 20-day moving average line currently at 2043. The short-term resistance level is 2075. Any moves past those levels could be viewed as breakouts or breakdowns.
Sector Analysis:
One sector chart that looks interesting is one that has generally lagged the broad market rally. The telecom sector (XTL) (IYZ) has only been a modest performer this year. Yet, even the telecom sector has worked its way into a potential breakout.
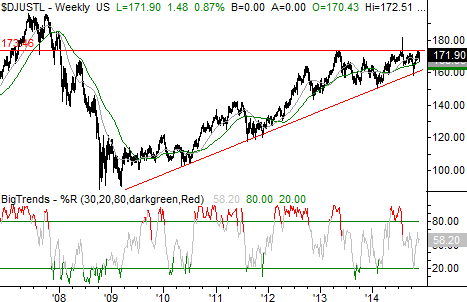
The Dow Jones Telecom Index (DJUSTL) below illustrates the idea. The sector has been prodded higher by a rising support line that extends all the way back to 2010. However, the index has been capped at the 173.5 level since early 2013. That convergence/consolidation is soon going to come to a close, though, as the rising support and line and horizontal resistance level are leaving the sector index little room to move. This pennant shape generally results in a bullish breakout move, though clearly there are never any guarantees. Whatever the case, the telecom index is one of the few that isn't technically overextended yet still testing bullish waters.
Verizon (VZ) and AT&T (T) comprise a bit over 30% of the holdings of DJUSTL, a fairly hefty weighting for just 2 stocks (something to keep in mind) -- the other top 10 holdings are (CTL) (SBAC) (LVLT) (TMUS) (FTR) (TWTC) (WIN) (S).
Dow Jones Telecom Index Weekly Chart
Trade Well,
Price Headley
BigTrends.com
1-800-244-8736