Cautiously Bullish, But Watch The VIX - Weekly Market Outlook
Cautiously Bullish & Watch The VIX - Weekly Market Outlook
Technically speaking, the bulls remained in charge last week, even with the sizeable pullback late Friday. But, it was such a low-volume feeble effort we may as well not even count it. The S&P 500 (SPX) (SPY) closed up 1.05 points (+0.005%), telling us nothing about traders' intentions or mindset over the past few days.
Nevertheless, we're still wrestling with the bigger picture (and opposing) facts that the market is overbought while the overall momentum remains bullish. How is this all going to end during what's supposed to be a highly bullish time of year? We'll dig into the details in a moment. Let's look at some of the overarching economic numbers first.
Economic Calendar
For it to be a holiday-shortened workweek, we sure got a lot of economic data to work through, particularly on the real estate front.
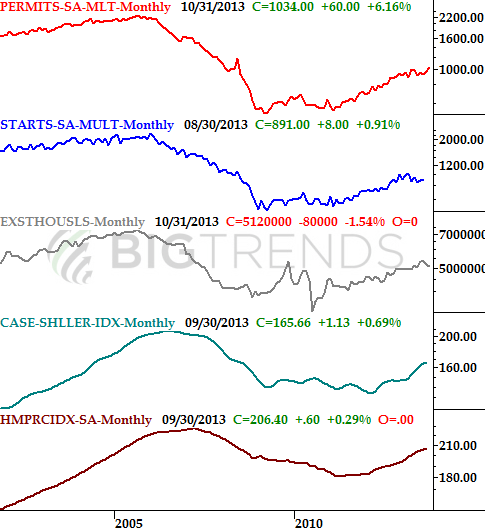
For starters, building permits ended up being issued at a pace of 1.034 million for October, up from September's strong number. Both the Case-Shiller Index as well as the FHFA housing price index said house prices are still on the rise. The Case-Shiller index said prices in September were up 13.3% on a year-over-year basis, and the FHFA reports that prices were up 0.3% in September compared to August's data. It'll be interesting to see how, or even if, the October shutdown affected prices.
Real Estate: Activity and Prices
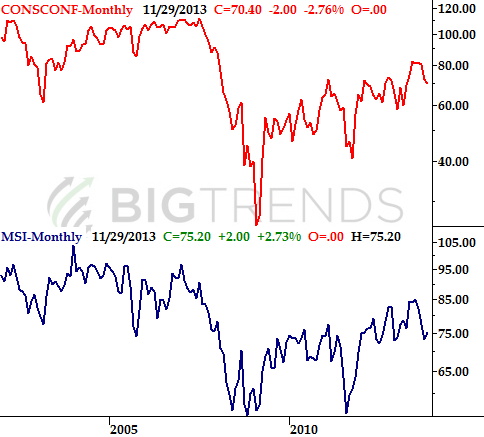
The only other major data worth a closer look that we got last week was on the sentiment front, and it was only interesting because the two data sets we watch sent us a mixed message. Specifically, the Conference Board's consumer confidence measure fell from 72.4 to 70.4 in November, but the Michigan Sentiment Index improved from October's 73.2 to 75.1 last month. It's too soon to say that the recent disruption in the improving confidence trend is a sign of bigger problems, but it's not too soon to be open-minded to that possibility.
Consumer Sentiment
Everything else is on the following grid:
Economic Calendar
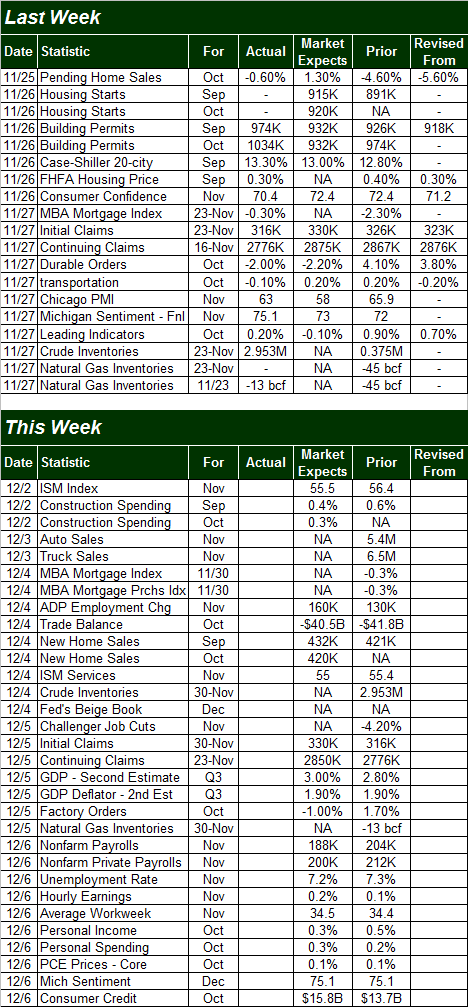
The coming week is absolutely loaded with data, partly because that's the way things usually are in thee very first full week of the month, and partially because we're still playing catch-up with data that was delayed by October's government shutdown.
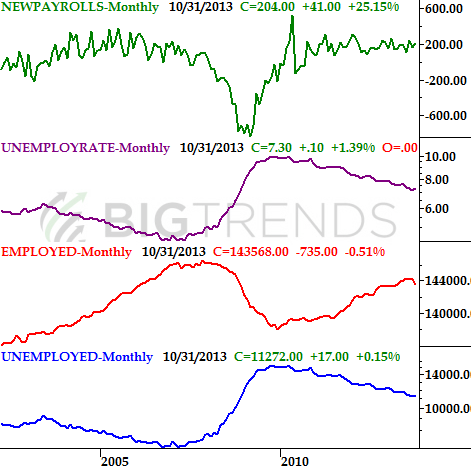
The biggest news will be on the employment front. On Friday we'll be getting last month's job-creation number and unemployment rate. The pros say we added 188,000 new payrolls last month, which roughly jives with the 160,000 new jobs ADP says were created in November. That should be just enough to move the unemployment rate needle from 7.3% for October to 7.2% for November. That's progress, technically, but not strong enough to get the economy off of life support. Indeed, the job-growth rate is actually expected to fall from October's figure of 204,000.
Payroll Growth, Employment
That's certainly not the only news in the lineup for this week, however. It's also going to be a big week on the real estate and construction front. On Monday we'll get the construction spending figures for September as well as October. Economists see decent growth for both months. On Wednesday we'll hear about September's and October's new home sales. The former should be up from August's pace of 421,000, but experts believe new home sales are going to fall from September's projected pace of 432,000 to 420,000 in October.
Stock Market Index Analysis
As was noted above, the market didn't move much last week, largely due to the holiday (and the mental break that traders took in front of and behind it). That doesn't mean there's nothing to be analyzed this week, however.
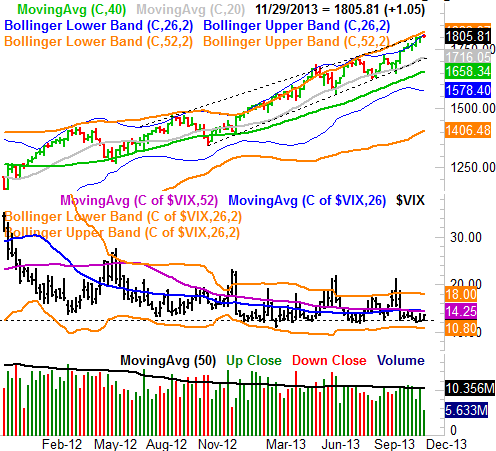
Just to put things in the right perspective, let's start with the bigger weekly chart. As was the case a week ago - though more so now - the weight of the 9% gain since early October is really starting to weigh things down. The same can be said for the fact that the S&P 500 is in the verge of bumping into its upper 52-week Bollinger band (orange)... another usual ceiling. It's possible stocks could continue to push up and into, and even above, that upper band line like it did between February and May, but that situation was the exception to the norm. The higher-odds outcome here is a pullback. Take a look.
S&P 500 & VIX - Weekly Chart
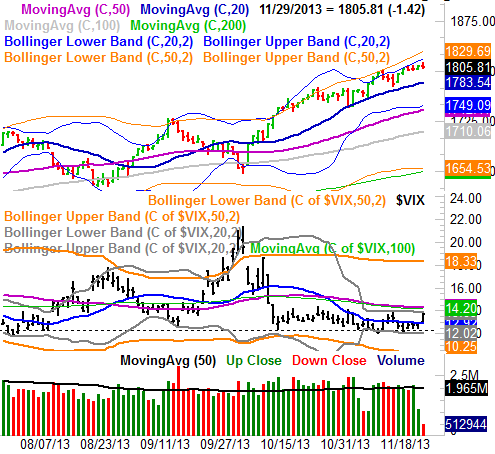
The weight of the recent gains is even more evident on the daily chart. Though the market is still rising, a visual inspection of the S&P 500's daily chart indicates that the momentum is fading. You'll also see on the daily chart that the lethargic CBOE Volatility Index (VIX) (VXX) finally started to move again ... upward. That's a hint that traders are starting to worry a little bit, though not a big one until the VIX actually moves above its big ceiling around 14.2.
S&P 500 & VIX - Daily Chart
Here's the problem with coming to any conclusions based on last week's action - the lack of participation and volume may mean things are skewed. Fortunately the market didn't really go anywhere rather than make a huge move last week, which makes it substantially easier to not jump to a conclusion.
So what's the game plan here? We have to remain bullish, only because the momentum is pointing in that direction. But, we're keeping things on a short leash, and you should know that even if we continue higher at the current rate of gain, it's going to be excruciatingly slow progress. In some ways a dip would actually be of some benefit in that it might jolt the market into some stronger action. [Either direction would be fine - we just need some movement.]
That being said, we know the 20-day moving average line at 1783.5 is a key floor; it acted as support and prodded a rebound in mid-November. Until the S&P 500 actually falls under that level, we have to remain in the bullish camp. If the S&P 500 should fail to find support at the 20-day moving average line, we'll use the support area around 1750 as a checkpoint target. Conversely, as long as the S&P 500 index simply traces its upper bands higher rather than soaring past them - inviting a wave of profit taking in the process - we'll assume more of this tepid bullishness is in the cards.
Trade Well,
Price Headley
BigTrends.com
1-800-244-8736