Can The 200 Day Moving Average Halt The Downtrend? - Weekly Market Outlook
Can The 200 Day Moving Average Halt The Downtrend? - Weekly Market Outlook
Not only was last week the worst week we've seen for stocks all year, it was the worst week we've seen since May of 2012. All told, the S&P 500 (SPX) (SPY) plunged 61.77 points last week... a 3.1% decline. We're now 5.6% under the S&P 500's peak of 2019.26, hit four weeks ago. The decline on Friday also saw the BigTrends TrendScore give a week-ending bearish reading on stocks for the first time in some time.
Any chance that could be enough of a selloff to let the market get back in a bullish groove? Maybe, but stocks are going to have to thread a very small needle to rebound from here without having more downside repercussions.
We'll take a look at the market's most likely scenarios in a second, right after a quick run-down of last week's and this week's key economic information.
Economic Data
Last week wasn't a particularly busy week in terns of economic reports. In fact, the only item of any real interest last week was the release of the FOMC minutes, which didn't even end with the publishing of a piece of data. It was still a key event, however, sending the market rocketing higher.... at least through the end of that day.
The crux of those minutes can be boiled down to two key sentences: "Some participants expressed concern that the persistent shortfall of economic growth and inflation in the euro area could lead to a further appreciation of the dollar and have adverse effects on the US external sector. At the same time, a couple of participants pointed out that the appreciation of the dollar might also tend to slow the gradual increase in inflation toward the FOMC's 2% goal."
It was dovish to be sure, prompting a recovery rally right when it looked like the market was falling off a cliff. The market ended up falling off a cliff later in the week anyway (more on that below), but it was still a short moment of glory before investors recognized there are still more challenges ahead that may be difficult to abate.
Earnings season gets underway in earnest this week. Everything else is on the following grid:
Economic Calendar
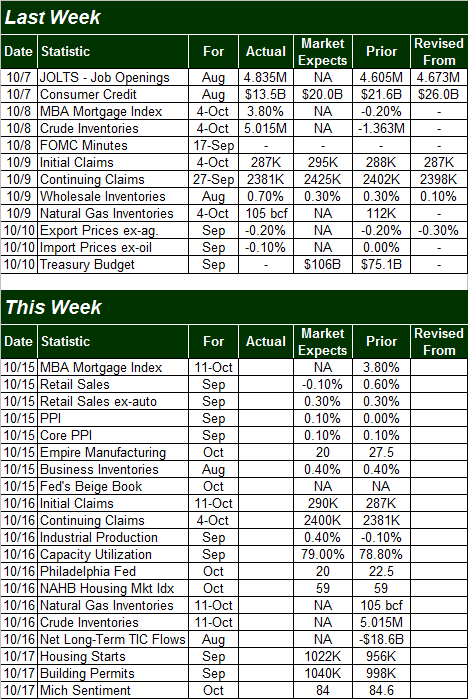
Source: Briefing.com
Clearly the coming week will be busier; a preview of some of the harder-hitting data is on order.
On Wednesday we'll get September's retail sales figures. The pros think weak automobiles sales are going to drag down overall progress here. Taking planes, trains, and automobiles out of the equation, retail sales improvement should be on par with recent, decent growth.
Retail Sales % Change (month to month) Chart
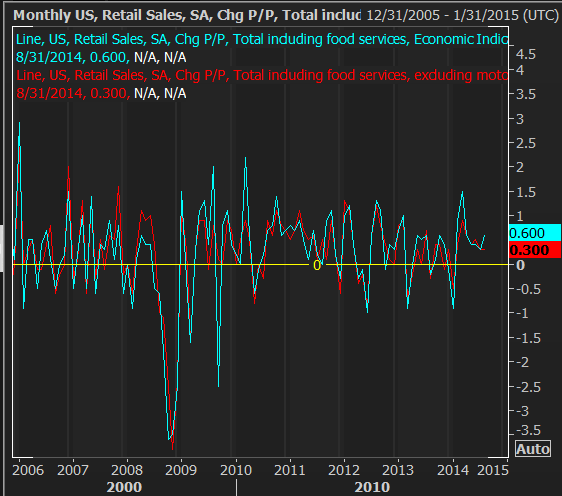
Source: Thomson Reuters Eikon
The Federal Reserve's going to give us September's capacity utilization and industrial production figures on Thursday. Both have been in bigger-picture uptrends, and still are. The last few months have seen a slower growth pace though, which should be seen as something of a red flag, Still, it's too soon to assume the worst.
Capacity Utilization & Industrial Productivity Chart
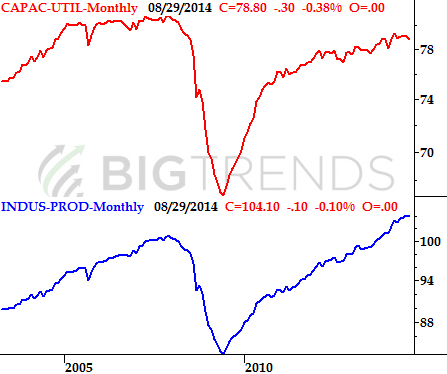
Source: Federal Reserve
Finally, on Friday we'll hear about last month's housing starts and building permits. Both of these data sets are broadly pointed upward too, but like capacity utilization and industrial production, neither is as compelling as they were just a few months ago. It wouldn't take much more weakness for these trends to turn negative.
Housing Starts and Building Permits Chart
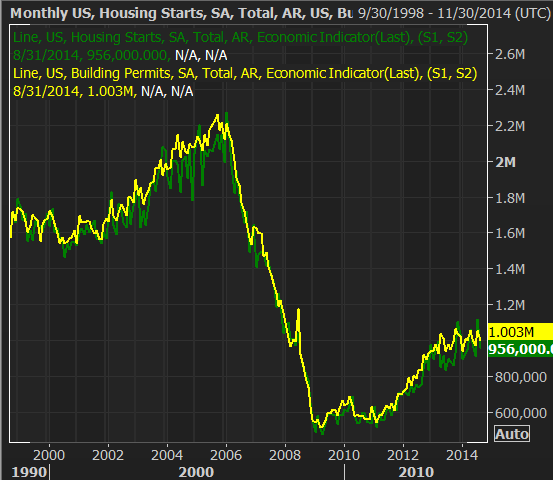
Source: Thomson Reuters Eikon
Keep in mind that Friday's real estate data is just the beginning of a bigger wave of real estate numbers. There's a lot more in the queue for next week.
Stock Market Index Analysis
Based on nothing more than the current momentum, there's no argument the market's in a bear trend at this point. Ironically, however, the severity of last week's drastic plunge is - in some ways - the most bullish thing that could have happened to stocks. Steep selloffs set up equally strong bouncebacks. So, with just the right nudge early this week, it's possible we could be back in an uptrend. We still need to be very careful about taking that bait though.
The daily chart of the S&P 500 looks a bit terrifying here. Even through Thursday it looked like there was a chance of the support at 1925, though the pace of selling was heating up on Thursday . By Friday that momentum fully took charge, and sent the index to multi-week lows. By that time the S&P 500 broke under 1925, the CBOE Volatility Index (VIX) (VXX) had already pushed well past its ceiling at 17.50.
S&P 500 & VIX - Daily Chart
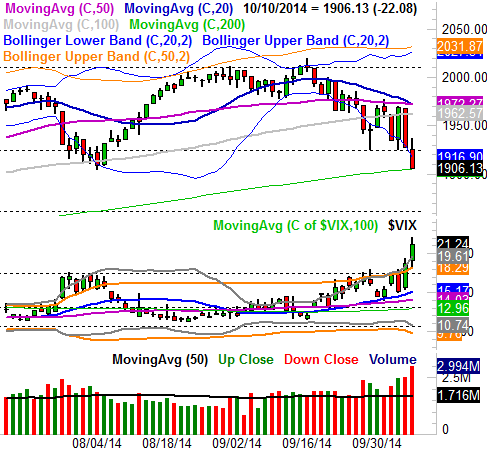
All charts created with TradeStation
It's interesting, however, how the selling seemed to magically stop right at the 200-day moving average line (green). Were the bulls preparing to make a stand there this entire time? It is, after all, the ideal place to stage a recovery.
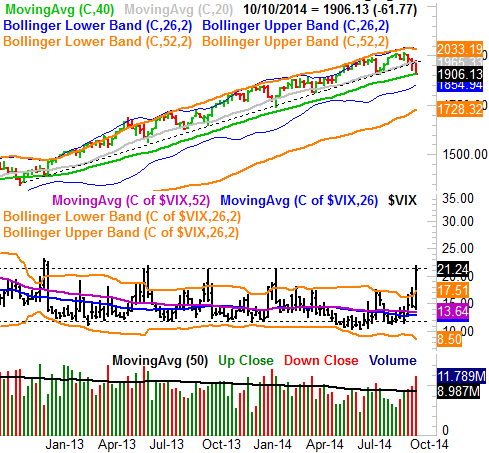
When we zoom out to a weekly chart we can gain a lot more perspective on this meltdown. Yes, we can see how the S&P 500 is still on the underside of a very important long-term support line (dashed), but it's on this chart we can also see the VIX has been halted at 21.40, which just so happens to be an even bigger ceiling for the Volatility Index. It's very possible the VIX is telling us the bottom has been made.... an argument made even stronger by the fact that the S&P 500's 200-day moving average line was exactly where the index's bleeding stopped on Friday.
S&P 500 & VIX - Weekly Chart
This is a delicate situation. From here, the odds actually favor a dead-cat bounce - a bounce that only takes shape because a chart has fallen so far and so fast that a bounce is a likely possible outcome. Dead-cat bounces tend not to last very long though, as their only job is to clean up extreme oversold situations. In this case, the bounce could carry the S&P 500 all the way back to the 1965-ish area where a major entanglement of moving average lines is forming. Should the index manage to move above that level, it could be quite the bullish catalyst.
Be careful about taking the bait, though, on a rally or bounce this week. The more likely outcome here is still a near-term top somewhere under 1965 and a resumption of more downside. If there is another bearish leg, it is likely to do even more damage than last week's. We're getting closer to the ultimate bottom, but it doesn't appear we're quite there yet.
Trade Well,
Price Headley
BigTrends.com
1-800-244-8736