Busy Week On Tap - Weekly Market Outlook
Although the market's uptrend may still technically be intact, there's no denying it's in question now. The very day after the S&P 500 (SPX) (SPY) pushed its way past a key resistance line, it also fell back under it ... in spades. That pullback didn't crush the uptrend, but we're close to falling off the edge of the proverbial cliff. We'll look at the make-or-break lines in a moment. The first thing we want to get out of the way is a look at last week's and this week's economics-based clues.
Economic Data
It wasn't too busy last week in terms of economic numbers, but much of what we got was relatively important stuff.
First and foremost, inflation appears to be under control. Two weeks ago we saw producer price inflation fall for a second straight month, to an annualized rate of 1.9%. So, we had a decent reason to expected consumer inflation to fall in June too. And sure enough, it did. Annualized consumer inflation rate fell from May's reading of 2.13% to 2.07%. These are very tolerable levels, and there's little on the horizon that suggests inflation is bound to grow in the foreseeable future.
Inflation Trends Chart
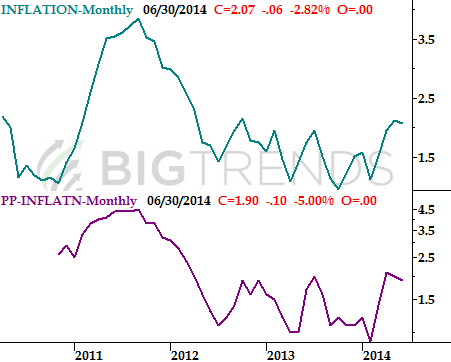
Source: Bureau of Labor Statistics
It was also a big week for real estate number, most of which were encouraging.
The good news was, the Federal Housing Finance Agency reported home prices increased by 0.4% between April and May, and existing homes sales reached an annual pace of 5.04 million. Home prices reached new multi-year highs - again - and are now at early 2008 levels. The rate of existing home sales is now at the strongest pace since October.
The bad news is, new home sales tumbled from a pace of 442,000 units to 406,000 units in June. That's the weakest reading since September of last year, though it should be noted there's usually a summertime lull in new home sales activity.
There's a little more real estate data on the schedule for this week, although most of it is in now. Here's how the overall real estate picture looks now.
Real Estate Trends Chart
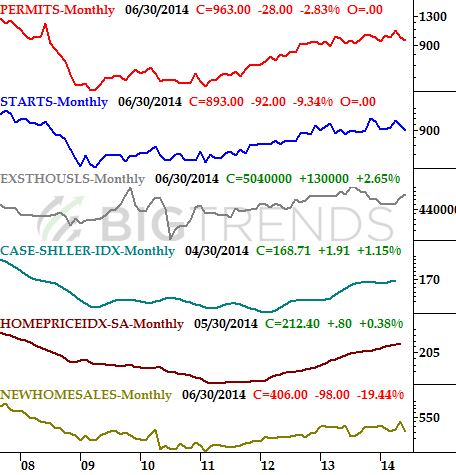
Source: Census Bureau, Standard & Poors, FHFA, and National Assn. of Realtors
All the rest of last week's data is on the table below.
Economic Calendar
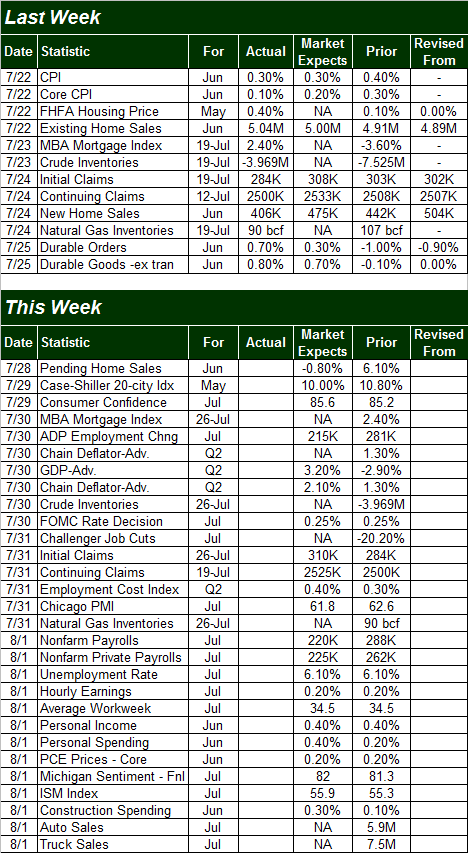
Source: Briefing.com
Clearly this week is going to be considerably busier in terms of economic numbers.
Beyond earnings season, the fireworks don't start in earnest until Tuesday when we hear about June's consumer confidence from the Conference Board. The pros are currently looking for a modest increase, from 85.2 to 85.6 for July, which would extend an already impressive uptrend. It jives with the long-term uptrend in the Michigan Sentiment Index, which we'll hear about on Friday. The pros currently expect a final score of 82.0 for the Michigan Sentiment Index, versus June's reading of 82.5. Still, it's on the rise overall.
Consumer Sentiment Chart
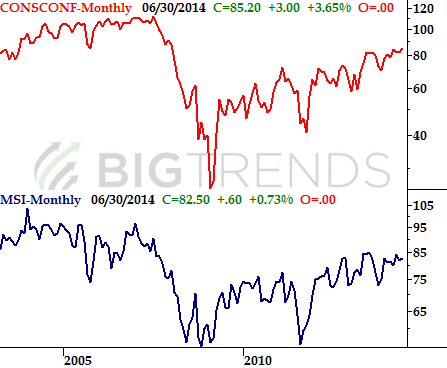
Source: Conference Board and Reuters
You'll also want to be on the lookout for Wednesday's GDP growth report. The current forecast is for a 3.2% improvement, which would be a welcome turnaround from Q1's 2.9% decline. That's a big number, and there may be little to no room for disappointment.
Of course, the big news for this week is going to be Friday's unemployment data. Economists don't expect to see any change in the unemployment rate, currently at 6.1%, and they product the addition of 220,000 new jobs. That's weaker than last month's surprising 288,000 new jobs, though it's still a decent number. Besides, given the trends (particularly of the numbers you don't hear discussed by the media), there's a good chance we'll see better-than-expected job growth.
Employment Trends Chart
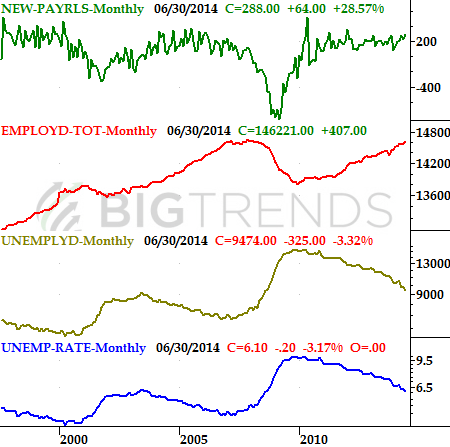
Source: Bureau of Labor Statistics
Stock Market Index Analysis
Technically speaking, the market logged a gain last week. It was an ugly gain, though, and stocks ended the week on the wring foot and could easily hit the ground running in the wrong direction this week. Yet, so far, the bulls have held the line where they need to in order to keep the rally at least on life support.
The chart of the S&P 500 below illustrates the whole thing. After fighting its way above the ceiling at 1986 (dashed) for a couple of days in the middle of last week, the bears had their way on Friday, decisively sending stocks lower. The tumble didn't push the S&P 500 below the all-important 20-day moving average line at 1974. If the correction is to come, that's going to be the first and perhaps most important clue.
S&P 500 & VIX - Daily Chart
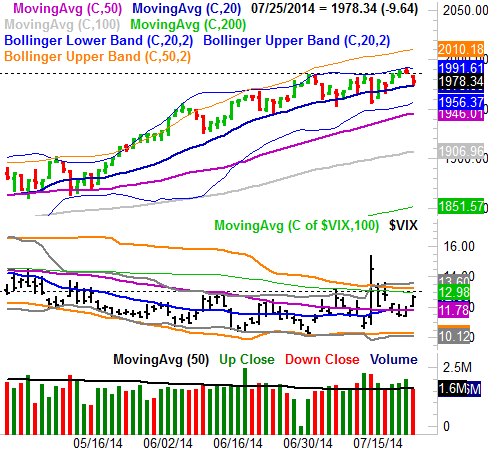
All charts created with TradeStation
The CBOE Volatility Index (VIX) (VXX) is still a huge factor in this discussion too. Although the VIX remains below what's become an enormous ceiling around 13.30, it does appear it's en route to a move above its resistance line. We've seen a couple of higher lows since late June, and at its current pace the VIX should be above 13.3 by next week. That will be a game-changer for stocks, even if the S&P 500 hasn't broken below its 20-day moving average line by that time.
While the uptrend remains intact, given how overbought stocks are at this point in addition to the fact that we've rallied nearly 10% over the course of 71 days without even a minor stumble (on top of the calendar), the odds of a pullback greatly outweigh the likelihood of more upside from here. Ergo, it wouldn't be a waste of time to start talking about a landing spot.
It's barely visible on the daily chart above, but the 200-day moving average line (green) currently at 1851 could be a biggie. A slide to that mark would be a "healthy" 7.0% slide from the peak. Just bear in mind the 200-day line rises a little each day, so be sure to adjust accordingly.
The moving average lines aren't the only way to mark a likely floor, however. Fibonacci retracement lines are also typical floors. And, the next realistic retracement level is 1924... a 38.2% retracement of the rally from the mid-April low to Thursday's high [the aforementioned 70-day span]. The 1923 area is also near where the 100-day moving average line (gray) would be by the time it could be tested. That would only be a 3.4% decline, which isn't enough to really hit the market's proverbial "reset" button. It would be closer to the normal-sized dip of late, however.
S&P 500 - Daily Chart, with Fibonacci lines
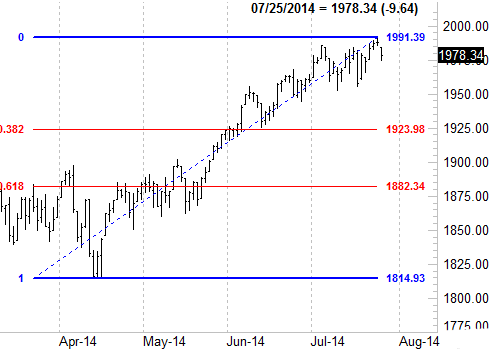
Interestingly, the 61.8% retracement level is at 1882, which is where the 200-day moving average line could be by the time it's tested. That area was also a point of contention between March and May, so it's apt to become a battleground again.
While the stage for a pullback may be set, the question remains - when will the ball get rolling? It hasn't yet.
Trade Well,
Price Headley
BigTrends.com
1-800-244-8736