Busiest US Factories Since Early 2008 - Weekly Market Outlook
Busiest US Factories Since Early 2008 - Weekly Market Outlook
Remember how awful things were two weeks ago? The S&P 500 (SPX) (SPY) plunged 2.6% that week, and it looked like the market was ready to finally dole out that overdue correction. Guess not. Last week, the S&P 500 erased nearly all of the prior week's loss, and ended the (shortened) trading week on a high note. This bodes well for a bullish start to this week.
But is last week's rebound just another fake-out, merely delaying an inevitable corrective move? Possibly, though it's possible the market's truly back in rally mode. Whatever the case [and we'll handicap the odds of both outcomes below], it may actually be a while before we get a clear answer. We'll show you why in a second. Let's first get the analysis of last week's economic data out of the way.
Economic Calendar
All in all, as of last week the economy not only appears to be pointing in the right direction, it appears to be accelerating its growth.
The fireworks got started on Monday of last week with March's retail sales. Retail spending was up 1.1% overall, and up 0.7% when taking automobiles out of the equation. Both are not only better than the expected numbers, but outright strong numbers.
We also got a decent dose of housing and real estate news. Although housing starts failed to meet expectations of a pace of 955,000, the annualized rate of 946,000 topped February's figure of 920,000. As for permits, March's pace of 990,000 was shy of the expected 1.003 million as well as short of February's 1.014 million, but it's still a solid figure when we needed to see some clues of a rebound on the housing and construction front.
Real Estate and Housing Trends Chart
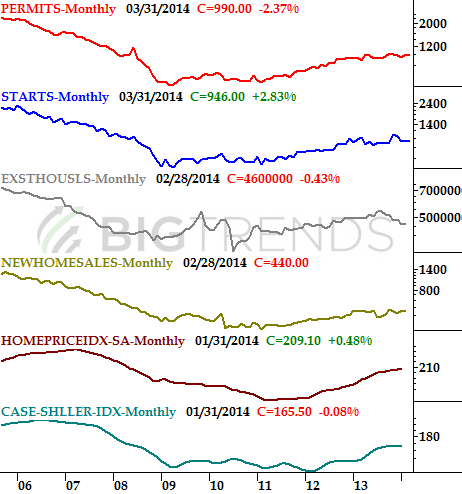
Source: Census Bureau, Standard & Poor's, and FHFA
We're going to round out the real estate picture this week with a look at existing homes sales and new home sales. New homes sales have been in a steady - even if lackluster - uptrend, but as the chart above shows, existing home sales desperately need a shot in the arm.
The rebound in home process is starting to wane too, that we're not in dire straits on that front just yet.
Finally, the Federal Reserve said the nation's factories were plenty busy last month. We're now utilizing 79.2% of our manufacturing capability - the best reading since early 2008, before the subprime mess torpedoed the economy - and the industrial production index hit another record high of 103.2.
Capacity Utilization and Industrial Productivity Chart
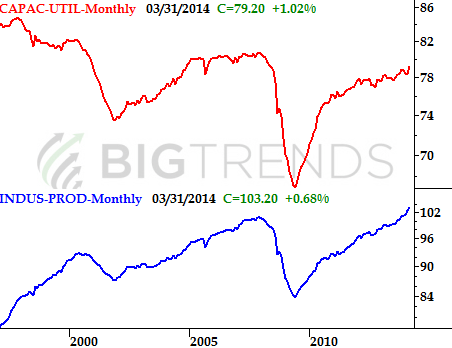
Source: Federal Reserve at federalreserve.gov
Together, the two data sets say the long-term economy (and therefore the long-term market) are on a growth trajectory. It may not prevent a short-term bearish move, but it does suggest any dip will be relatively short-lived.
Economic Calendar
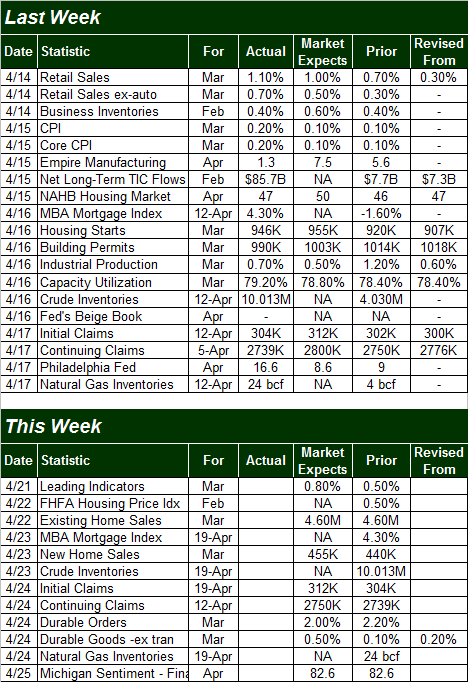
Source: Briefing.com
There's not much in the lineup for this week, and the most important data is something we already mentioned.... more news from the real estate and construction market. If last week's number were any clue, this week's figures should show modest progress for housing as well.
Stock Market Index Analysis
While the S&P 500 is still the most meaningful marketwide index out there for the long haul, for the time being, the NASDAQ Composite (COMP) (QQQ) remains the most telling and the most interesting of the broad-market proxies. So, we'll start there this week by picking up where we left off last week.
And where was that? You may recall that although the composite was sinking pretty rapidly at the time, there was still a huge support level right around 3970 that could still become a major bullish reversal point. And, guess what happened. While the NASDAQ Composite actually had to pull a little bit beneath that floor by hitting a low of 3946.03 on Tuesday and actually test the 200-day moving average line (green), in retrospect it's quite clear that the 3970 area was a real psychological battleground between the bulls and the bears. All the bulls needed was to be put to the test, and POOF! Instant rally.
NASDAQ Composite Daily Chart
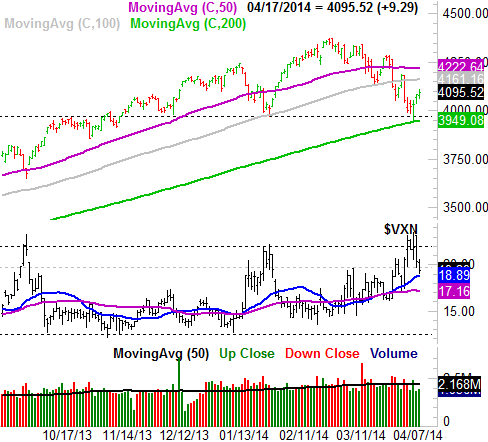
All charts created with TradeStation
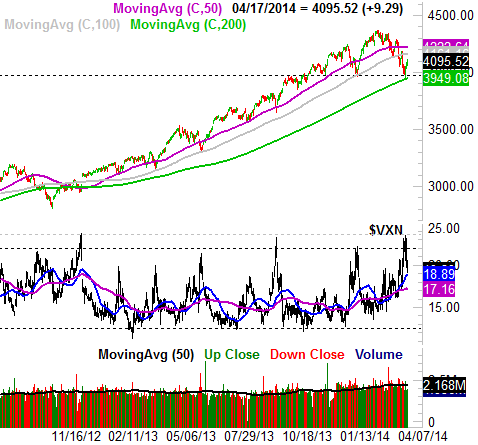
That's not the only clue on the NASDAQ's chart that suggests the sellers have exhausted themselves and are yielding to the bulls again. As we've also pointed out a handful of times in recent weeks, the composite's volatility index - the VXN - has had a tendency to find a ceiling at 22.0, and if it's hit, then odds are good that's where the bulls will go bargain shopping as well. We can see the VXN needed to test the waters just a little above there before rolling over, but it pretty much happened where it should have happened. The longer-term daily chart of the NASDAQ and the VXN below puts the importance of the VXN's ceiling at 22.0 in perspective, and why the odds (for the time being anyway) favor getting bullish when we see the VIX reach that level.
NASDAQ Composite & VXN Long-Term Chart
So we're bullish? While there are still several things that could nip this rally in the bud, from a momentum-follower's perspective, yes, we are bullish... though cautiously.
While the risks are evident on the NASDAQ Composite's chart, they're easier to illustrate on the chart of the S&P 500, so we'll use that large cap index to explain the two major potential pitfalls we're still facing here.
The biggest of those pitfalls is the fact that even though the market may be in rally mode right now, the S&P 500's ceiling at 1885 still looms above. Until and unless the S&P 500 clears that hurdle - and that won't be easy now that both upper Bollinger bands are starting to bear down - the potential reward is fairly well matched by risk.
S&P 500 & VIX - Daily Chart
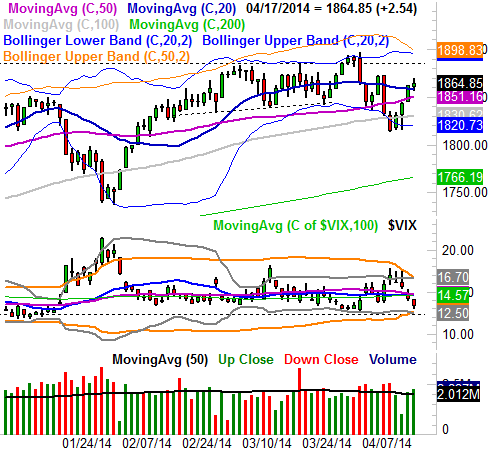
The other aspect of the above chart that could be troubling is how the S&P 500's CBOE Volatility Index, the VIX (VXX), is just a hair above its major floor at 12.3 [yet the VXN isn't testing its major floor yet]. If the VIX doesn't have any room to keep falling, the market may not have much room to keep rising.
Still, as of the way things appeared to end last week, the momentum is bullish, as is our bias. Just keep everything on a short leash, as earnings, Ukrainian tension, news from China, and a few other ongoing stories could change that momentum in a hurry. We'll talk about that if and when the time comes.
Trade Well,
Price Headley
BigTrends.com
1-800-244-8736