Bullish Undertones After Recent Weakness - Weekly Market Outlook
Bullish Undertones After Recent Weakness - Weekly Market Outlook
While Friday may have been a bullish day that pulled the market away from the side of the cliff at the last minute, it's still premature to say all is well; there's still plenty of opportunity for the bears to growl again and push the broad market back into a downtrend.
The details of the make-or-break levels are below. Let's first take a look at the relevant economic data, there are a handful of key data nuggets for this week.
Economic Data
We explained a week ago that last week's economic data dance card was pretty empty, and as expected, nothing in the way of economic news shook the market up. All of last week's announcements are on our grid below:
Economic Calendar
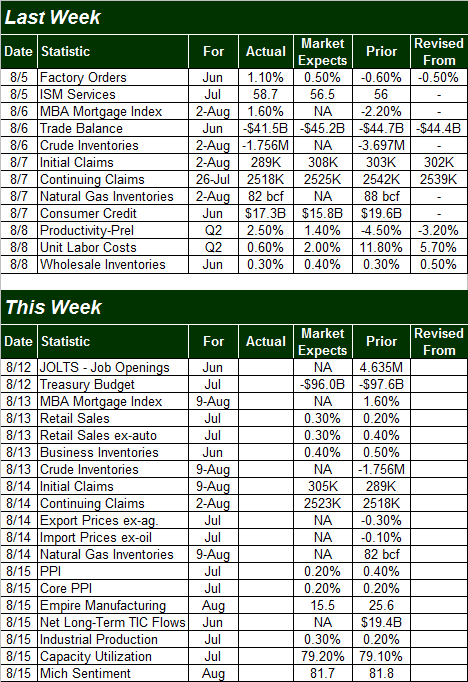
Source: Briefing.com
This week's economic calendar is a little fuller. The party starts on Wednesday's with July's retail sales. You may recall from last month that the growth pace is still positive, but broadly slowing. July's figures aren't expected to be encouragingly different than we've seen of late. Here's the growth trend as of June:
Retail Sales - YOY Growth Rate Chart
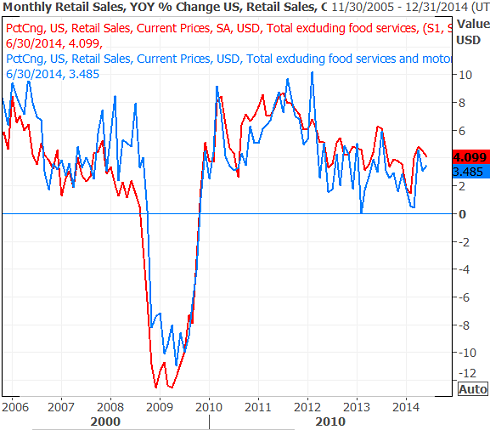
Source: Thomson Reuters Xenith
We don't get any noteworthy data again until Friday, with July's producer price inflation report and last month's capacity utilization and industrial productivity figures.
The producer price inflation news is mostly going to be a preview of next week's consumer inflation data. Regardless, while the inflation scare from a couple months ago seems to have been quelled by tamer annualized rates, rising inflation is still a possibility. The pros don't currently expect to see any major jumps from June's producer price inflation rate of 1.9%, but nothing can be ruled out here.
Annualized Inflation Trends Chart
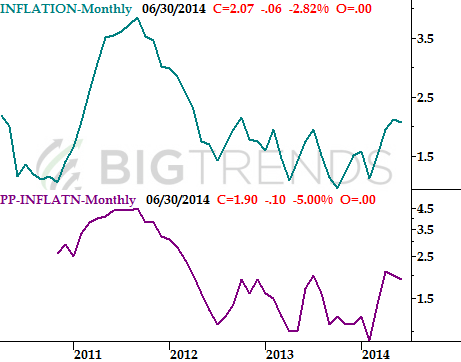
Source: Bureau of Labor Statistics
As for July's industrial productivity and capacity utilization, both have been trending higher for years now. Economists foresee more of the same moderate growth on both fronts for July too.
Industrial Productivity and Capacity Utilization Chart
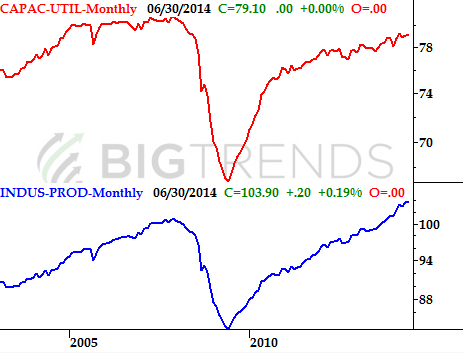
Source: Federal Reserve
While the capacity utilization and productivity numbers don't (and shouldn't) have much impact on the market's near-term swing, the correlation between then and the long-term market is uncanny. As long as both utilization and industrial productivity are pointed higher, the bulls market should remain intact.
Stock Market Index Analysis
Thanks to Friday's strong rally, the market closed in positive territory for the week. It's still too soon to say the market is back in an uptrend, though. Stocks could still easily move just a little lower, fall under crucial support levels, and then really start a selling avalanche. It all really depends on how things take shape this week.
Let's start this week's analysis with a look at the weekly chart of the S&P 500 (SPX) (SPY). As we pointed out a week ago, the index has remained in an uptrend since late-2012 primarily guided by a support line (dashed) that's now been tested five times (the fifth time was last week). As has been the case four times before, the floor held up, stopping the downtrend and at least acting as if it wanted to move on to higher highs. The S&P 500 has also frequently used the 100-day average line (gray) as a floor several times since late-2012, including last week.
S&P 500 & VIX - Weekly Chart
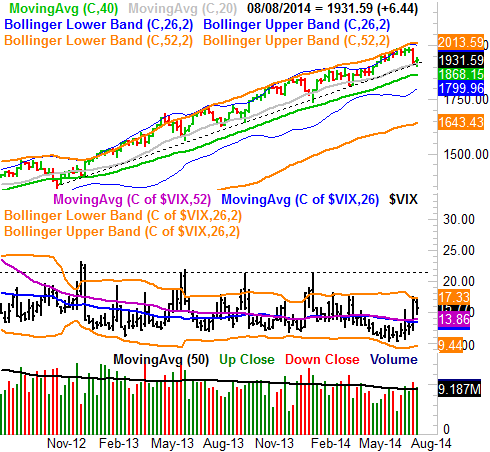
Charts created with TradeStation.
While the index isn't far enough removed from the floor around 1922 to say with a great deal of certainty that the bigger uptrend is still intact, it certainly looks as if that's the way things are.
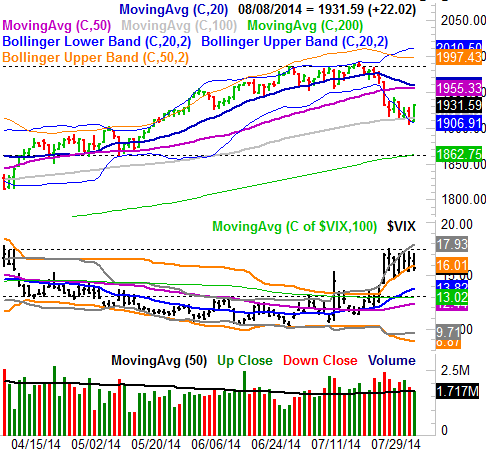
Things look even more bullish when we zoom into a daily chart. As you can see on the daily chart of the S&P 500 below, we saw a strong reversal from the stock index on Friday (from Thursday's plunge), with a higher high and higher low on Friday, and a close above Thursday's high on Friday. Bolstering the bullish argument is the fact that the S&P 500's CBOE Volatility Index - the VIX (VXX) - seems to have hit a ceiling of its own around 17.3 all last week, and finally gave up on trying to push past it on Friday. Friday's close for the VIX was at the low for the day, and back under its upper 50-day Bollinger band. Point being, the bulls were taking charge again to end last week.
S&P 500 & VIX - Daily Chart
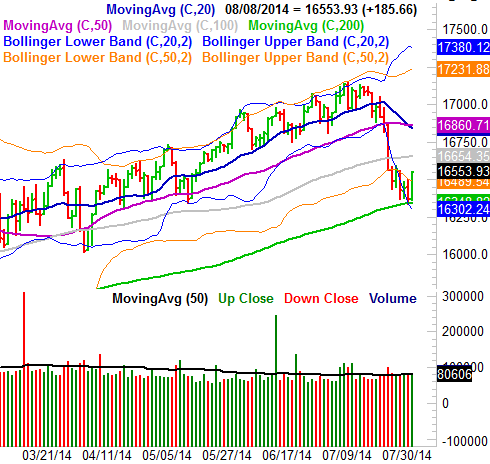
The bullish case is made even better when we look at the daily chart of the Dow Jones Industrial Average (INDU) (DIA). Last week all it took was a perfect kiss of the 200-day moving average line (green) to stop the selling and start a rally.
DJIA Daily Chart
So we're all-out bullish? Not quite.
Admittedly, it's impossible to deny Friday's bounce was an impressive move made at a point when the market needed such a move the most. But, knowing what we know about this current market, we can't trust one good day to be the harbinger of prolonged bullishness. In fact, Friday's gain may have been too strong for its own good, inviting profit-taking early this week.
Even if the bulls do follow-through early this week, though, there's a great deal of resistance not too far above where the major indices closed last week. For the S&P 500, that ceiling is 1956, where the 20-day moving average line and the 50-day moving average line are about to converge. For the Dow Jones Industrial Average there's a key ceiling at 16,860, where its 20-day and 50-day averages have intersected. Both indices could climb back to those levels and still not rekindle the uptrend. We'd need to see moves beyond those levels to say with any assurance that we've sidestepped a bigger downtrend. And, it seems implausible that we could move that far given the time of year and the market's frothy valuation.
There's another bearish red flag to keep in mind too. While Friday was a bullish day, the biggest winners were the S&P 500 and the Dow. The laggards were the Russell 2000 small cap index (RUT) (IWM) and the NASDAQ Composite (COMP) (QQQ). While one day does not make or break a trend, it's an interesting oddity. When the market's truly bullish, the NASDAQ and the Russell 2000 tend to lead, as the stocks in those indices are the riskier and more aggressive plays.
Whatever the case, this week is going to be a pivotal one. If the S&P 500 breaks under its floor around 1915 again, that second entry into bearish territory could be the beginning of a more serious correction. For the Dow, the line in the sand is 16,348.
Trade Well,
Price Headley
BigTrends.com
1-800-244-8736