Bullish Pivot - Weekly Market Outlook
Another winning week for the market, this one being much better than the prior one. All told, the S&P 500 (SPX) (SPY) followed through on the reversal clues it gave us two weeks ago, rallying 2.3% last week.
Now that the ball is rolling again, does the market have what it takes to keep going? From an unbiased, scientific point of view, yes, it looks like the bulls are in charge. Still, it would be wise to be prudent and cautious here. We'll show you all the pros and cons of last week's action in a moment. Let's get the key economic numbers out of the way first.
Economic Calendar
All in all, despite the gain we saw from stocks last week, the economic data was.... not good. The two most important data sets in the lineup both moved in the wrong direction, and though one month does not make a trend, all trends start out with that first step.
The first of the red flags we saw was January's retail sales. Counting cars, they fell 0.4%, but even with automobiles taken out of the mix, retail spending was flat. Those were both shy of forecasts for no growth with automobiles being figured in, and an outlook of 0.1% growth without cars being thrown into the mix.
The other worry that popped up late last week was on the factory activity front. Rather than growing again, it slumped. Industrial productivity fell 0.3% instead of growing the expected 0.3%. And, capacity utilization fell from 78.9% to 78.5%; the pros were looking for a move to 79.4%.
Capacity Utilization and Industrial Production Chart
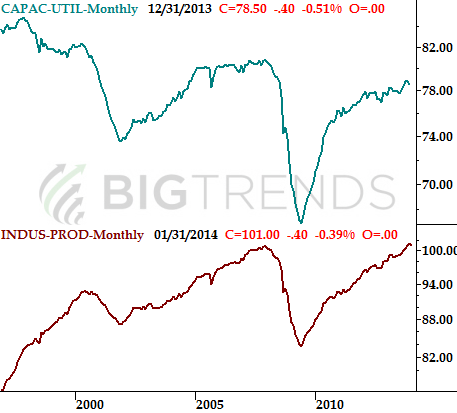
It's too soon to sound the alarm bell. These two pieces of data need to sink two or three months in a row before assuming the worst. But, given that the correlation between the long-term market trend and the capacity/productivity data is so strong, this is data that buy-and-holders need to pay very close attention to in March and April, now that we've taken that first step in the wrong direction.
Everything else is on the following grid.
Economic Calendar
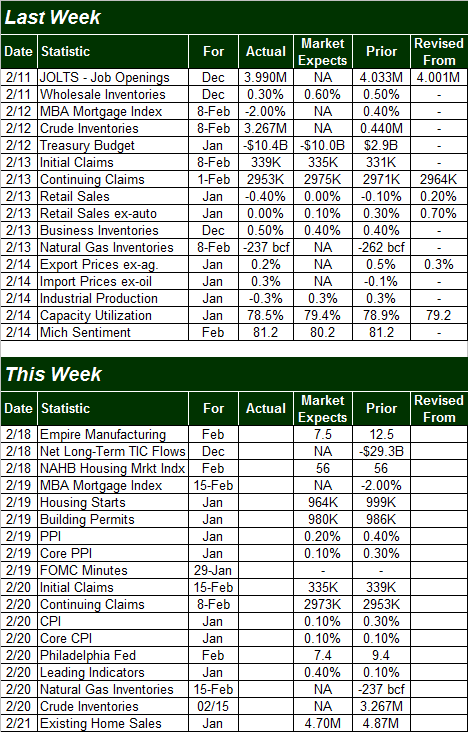
The coming week will be a slightly busier one, with a big dose of real estate and construction data on the way.
That party gets started in earnest on Wednesday, with January's housing starts and building permits. Economists are looking for slight dips for both numbers, though nothing that should be game-changing. On Friday we'll hear January's existing home sales pace. We should see a slightly more troubling slowdown there, with the pros looking for the pace to fall from December's 4.87 million to 4.7 million for January.
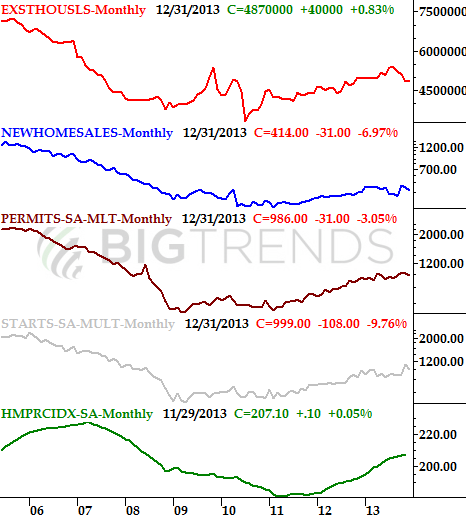
As you can see on our real estate data-trend chart below, there's not a lot of wiggle room here anymore. The trends on most of these fronts have become a little wobbly in recent months anyway, and any shortcoming now could be a true trend-changer.
Real Estate Data Trends Chart
We're also going to get a double dose of inflation data this week, with the producer price index data for January due on Wednesday, and the consumer price index in the queue for Thursday. Both are at healthy, sustainable levels right now, and aren't projected to change much for last month. But, given how rapidly gold prices have rallied since the end of January, even a modest shortcoming on the inflation front could be a problem for Gold (GLD). Conversely, inflation would have to roll in remarkably higher than anticipated to spur gold any higher from here.
Stock Market Index Analysis
We started out last week's look with a weekly chart of the S&P 500 for a reason, and the core of that reason ended up panning out quite nicely. Specifically, the T-shaped doji bar we saw materialize (with the open and close right at the high of a very tall bar) ended up being the expected pivot into a reversal. Now that the ball's rolling, there's nothing to stop it until we get to the 1880 area. That's where the weekly chart's 26-week and 52-week upper Bollinger bands are right now. As you can see going back in time on the S&P 500 weekly chart, the index usually tests one or both of those lines before any rallies hit a headwind.
S&P 500 & VIX - Weekly Chart
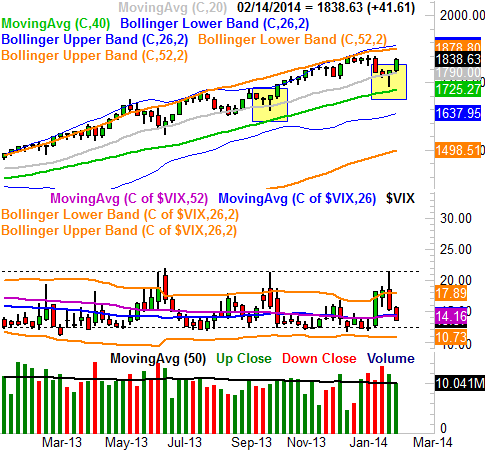
The CBOE Volatility Index (VIX) (VXX) ceiling at 21.4 may have also had something to do with last week's marketwide bullishness. As was the case with the S&P 500's T-shaped reversal bar a week earlier, the VIX's bump into a known resistance line at 21.4 (dashed) and sharp reversal also suggested a swing back into a bullish mood. That downtrend from the VIX continued into last week, and like the S&P 500, the VIX has room to keep moving in its current direction before hitting a headwind. The VIX could fall all the way back to the 12.40 area before it got to levels where the market starts to struggle.
The one thing we would have liked to have seen behind last week's bullish effort was a little more volume. But, what we get wasn't alarmingly low. We could still rally up to the 1880 area - give or take - before a lack of volume/participation starts to be a problem.
Does anything change when we zoom into the daily chart? The premise doesn't change, though where the market might hit a headwind does change a little. In other words, the trend still looks bullish here, but the possible top-out level could be somewhere else.... like the previous peaks at 1850 (dashed). By the time that level could be tested - possibly even by the time you're reading this - the S&P 500's upper 20-day Bollinger band could be there too, lending the horizontal ceiling a helping hand.
S&P 500 & VIX - Daily Chart
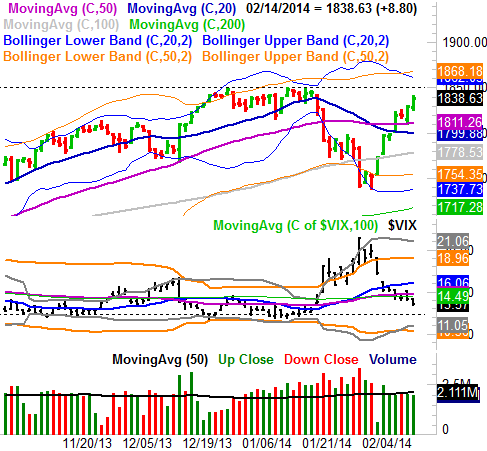
With all of that being said, while the momentum is bullish, this isn't a smooth-sailing environment. As long as the S&P 500 doesn't pull back under the 20-day moving average line at 1800, however, the undertow will remain bullish. Point being, don't assume the index is going to head straight towards 1850 early this week. It may need to peel back a little and get a running start to get all the way there. And of course, if the S&P 500 manages to break through 1850, the odds of a move to the 1880 level get significantly better.
Trade Well,
Price Headley
BigTrends.com
1-800-244-8736