Biggest 2 Week Gain Since 2009 - Weekly Market Outlook
Biggest 2 Week Gain Since 2009 - Weekly Market Outlook
Three weeks ago, the market was on the brink of turning a minor pullback into a major meltdown. In the two weeks since then, the market has done something it hasn't done in years (since 2009, see further below in the article). What's that? Log a 7% gain in just the span of two weeks. The close at new record highs (for the S&P 500 (SPX) (SPY) and the DJIA (INDU) (DIA) anyway) is just a little bullish gravy.
There's such a thing as "too much" though, and if there was ever a case where stocks have traveled too far, too fast, the latter half of October most definitely qualifies. That's not to stocks can't continue to rally from here. If they do, though, the pace and length of the gain is going to graduate from "rarity" to "unheard of." All well and good, but when you start needing the market to do things that are practically unheard of, it's time to get a little concerned.
We'll weigh the odds in a moment. The first information we want to dissect is last week's and this week's major economic announcement.
Economic Data
There was certainly no shortage of economic information last week. The hardest-hitting of all, though, had to be the release of the FOMC's policy meeting minutes and any subsequent change in interest rates. There was no change in its base interest rate of 0.25%, of course, but a change was never expected on that front. What mattered is the tone of the minutes, and the words the committee chose to describe the assessment of the economy as of October.
The two key phrases this time around were "considerable time" and "the likelihood of inflation running persistently below 2 percent has diminished somewhat." The former refers to the FOMC's expectation regarding how much longer rates will remain low, while the latter explains.... well, it clearly indicates the Fed isn't concerned about the slow deterioration of inflation rates to sub-2.0% levels.
Notably gone from October's meeting minutes was the term "significant underutilization" used to describe the Fed's opinion on the overall labor market in September. Now those labor impasses are "gradually diminishing."
When all was said and done, Janet Yellen and her cohorts decided the best change to make was none, thus ending the bond-buyback program as planned, and holding interest rates steady at rock-bottom lows.
The FOMC minutes weren't the only big economic news last week, however. We also got an update on the average consumer's mood, which apparently is as strong as it's been in years. The Michigan Sentiment Index hit a multi-year high of 86.9 for October, while the Conference Board's consumer confidence score hit a multi-year high of 94.5.
Consumer Sentiment Trends Chart
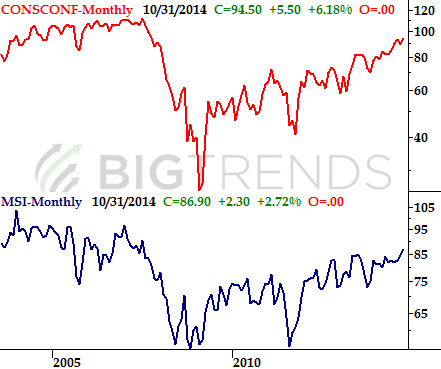
Source: Conference Board and Reuters
The third quarter's GDP growth rate was a solid 3.5%. With the exception of Q1's stumble (largely presumed to be caused by inclement, debilitating weather), there's been little to complain about on the GDP front for the past several quarters.
GDP Growth Chart
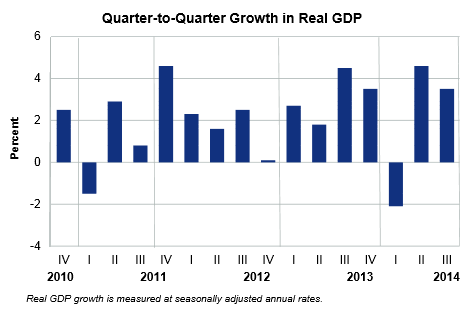
Source: Bureau of Economic Analysis
Last but not least, while the durable orders figures dropped last month, that negative turn deserves a footnote. How so? Although the overall figure fell 1.3% and the durable goods orders not counting transportation fell 0.2%, (1) that was only in comparison to August's levels, and (2) the kinks are still being worked out from July's huge surge in orders... which led to a relative plunge in August. The longer-term durable orders figure is still a positive one.
Everything else is on the following table:
Economic Calendar
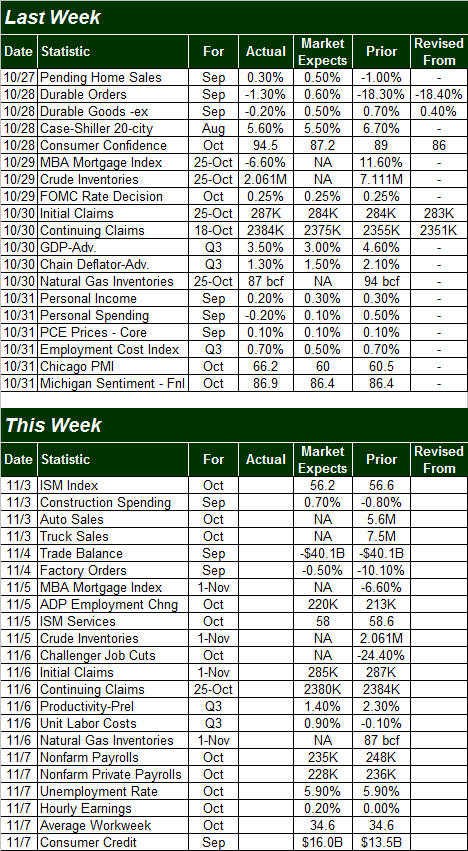
Source: Briefing.com.
The coming week is going to be a busy one, but most eyes are going to be focused on this Friday's update of the employment picture. Economists aren't expecting any significant change from September's numbers, with unemployment projected to hold steady at 5.9%. Any surprise miss of that projection though (for better or worse) could certainly move the market.
Stock Market Index Analysis
We weren't kidding above when we said the size of the rally over the past couple of weeks was peculiarly large. The last time the S&P 500 advanced 7% in two calendar weeks was in July of 2009. That gain was in the very early stages of the bull market though, and though it was an 11.3% move, it was still only a 100 point gain. The gain made over the most recent two week span was good for 132 points.
Regardless of the details, there's no getting around the fact that stocks are pushing their luck now. The momentum is technically bullish, but this would be the perfect opportunity for the bears to throw the bulls a right hook.
Let's start with a look at the daily chart of the S&P 500.
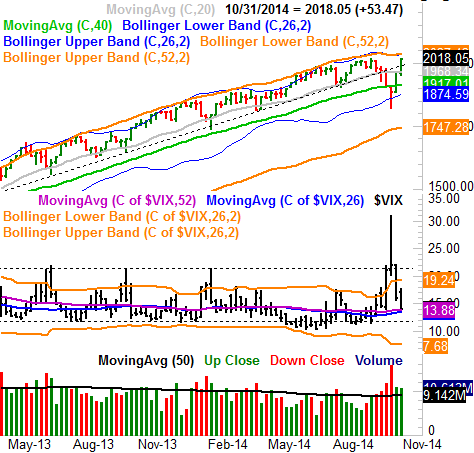
Kudos to the bulls for not giving up. That persistence may have reached dangerous levels, though. The big resistance line at 2010 has been cleared, and though the S&P 500 didn't technically make it above the 2019.26 peak hit back on September 19th, the close at 2018.05 was a record high close for the large cap index.
So what's wrong with that? Nothing, on the surface, but the question of sustainability has to be asked, especially now that the S&P 500 has left not one but two gaps behind over the past two weeks. The market generally doesn't like to leave gaps unfilled. Translation: There's a lot of good reason to expect downward pressure sooner or later.
S&P 500 & VIX - Daily Chart
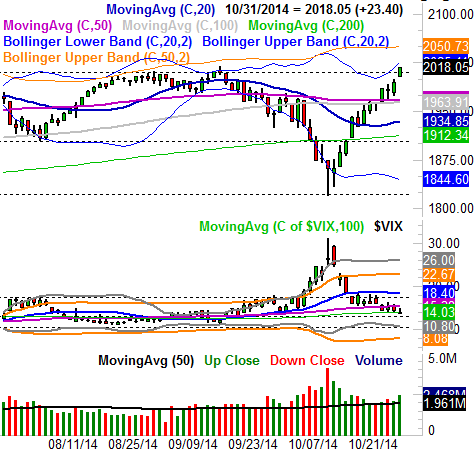
All charts created with TradeStation
On the flipside, the CBOE Volatility Index (VIX) (VXX) has NOT yet hit a major floor, which implies the stock market itself has not hit the ultimate top just yet. It's close, however. When/if the VIX gets to the 10.80-ish area and the overbought market hasn't yet started to fall back yet, get worried.
To be clear, this isn't necessarily a long-term pessimistic outlook. Even a very modest stumble for stocks would go a long way in clearing off any overbought pressure. So, don't be too afraid. The S&P 500 could fall all the way back to the 1920 area, give or take, and still technically be in an uptrend. We're just saying the rise over the past two weeks was so dramatic, a little profit-taking can't be a surprise. [The 1920 area is where the 20-day and the 200-day moving average lines will converge.]
And for what it's worth, it's possible - even if not likely - the S&P 500 could keep on trucking higher even though it would be running on fumes. The upper 50-day Bollinger band now stands at 2050, and if the upper 20-day Bollinger at 2025 doesn't cap the rally, the 50-day band line almost definitely will. Again though, that's the lower odds possibility at this point.
Zooming out to a weekly chart of the S&P 500 doesn't tell us anything new, but it does put the past five volatile weeks in perspective. It's been quite a roller coaster ride recently, but the bigger trend remains bullish.
S&P 500 & VIX - Weekly Chart
For better or worse, the longer-term weekly chart of the S&P 500 confirms we're in an uptrend, but it also confirms that the market isn't infallible here. The selloff from three weeks ago broke under the 200-day moving average line (green) for the first time in years, and the VIX broke above its ceiling at 21.4. Although both are back on the bullish side of those respective lines, if the bears were willing and able to do it once, they're likely to be willing and able to do it again. The next time, however, investors may not be as willing to rekindle the long-term rally. We'll be watching the technical floors closely from here.
Bottom line? This is a tricky time for stocks. The market was tolerant of the dip three weeks ago, but may not be so tolerant the next time it happens. On the other hand, there's something of an invisible valuation ceiling stocks can't push their luck with either. With third quarter earnings mostly in-hand, we know the S&P 500 itself is valued at a trailing P/E of about 17.6. That's getting a bit frothy . The forward-looking P/E is around 15.6, so the S&P 500 could grow into its valuation. For perspective, assuming past valuations are the norm, it could arguably take a full twelve months for the S&P 500 to gain just another 12%. Something's got to give somewhere, and the easiest solution to the valuation problem may well be another - and more significant - pullback. It'll be interesting to see how the market deals with it.
Trade Well,
Price Headley
BigTrends.com
1-800-244-8736