Between A Rock & A Hard Place - Weekly Market Outlook
Between A Rock & A Hard Place - Weekly Market Outlook
The third weekly loss in a row has brought the broad market down 2.4% from its recent peak. In the grand scheme of things, it's not much... not even enough to call a full corrective move. Even so, there are glimmers of hope that the selloff has run its full course (though bear in mind the short-term momentum is technically near bearish).
The good and the bad are dissected below, right after a quick examination of last week's economic news and a preview of this week's economic numbers.
Economic Data
A fair amount of economic information was unveiled last week, but little of it hard-hitting stuff. The only items of real consequence were February's retail sales and last month's producer inflation rates. We'll limit our looks to those two items.
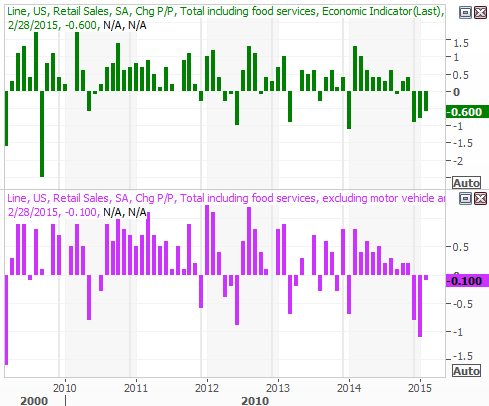
On the retail sales front consumer spending was down 0.6% overall, and off by 0.1% when taking automobiles out of the equation. It was the third month in a row seasonally-adjusted retail sales have slipped, which would be concerning were it not for one thing not well explained in all the commentaries regarding retail sales in February -- all of the decline can be attributed to weak gasoline prices. Retail sales at places other than gas stations was actually rather firm, for a February.
All the same, the theory is, what consumers are saving at the gas pump should be diverted into other categories of consumption. That's not happening.
Retail Sales Chart
Source: Thomson Reuters Eikon
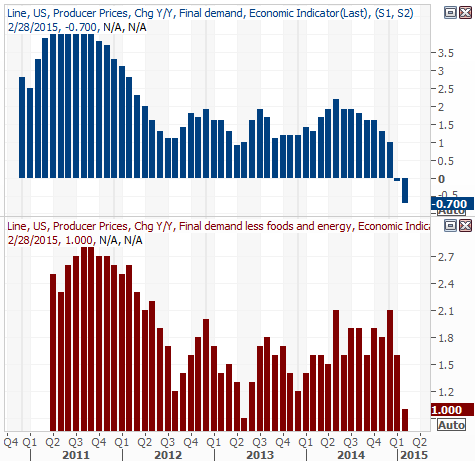
Though it's not the closer-watched consumer inflation data, we got a preview of that important information via the producer price inflation numbers reported on Friday. They were down, again, this time to the tune of 0.5% overall, on a core as well as a non-core basis. Annualized, the producer price inflation rate now stands at -0.7% overall (counting food and energy), but is still a paltry 1.0% after taking food and energy out of the equation.
Producer Price Inflation Annualized Chart
Source: Thomson Reuters Eikon
Everything else in on the table below:
Economic Calendar
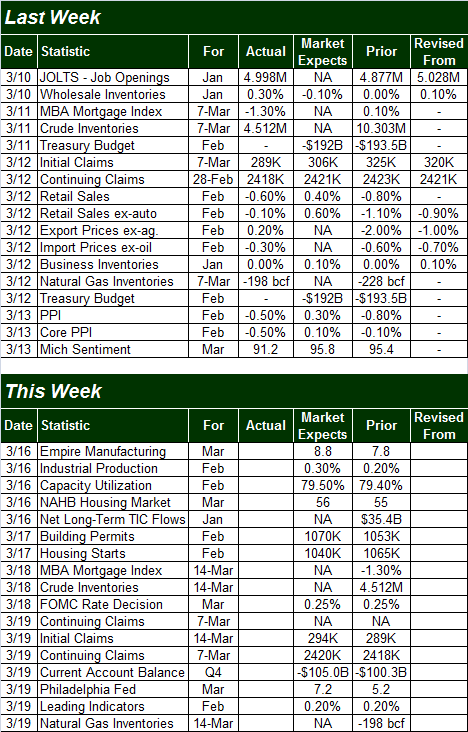
Source: Briefing.com
This week is a relatively busy one too, kicking off with industrial production and capacity utilization report on Monday, followed by Tuesday's housing starts and building permits, which leads into Wednesday's interest rate decision from the Federal Reserve. It's unlikely any changes will be made, but Janet Yellen could change the wording/language used to describe when the Fed might actually make that move.
Stock Market Index Analysis
When all was said and done by the time the closing bell rang on Friday, the market ended up doing what it does best in recent months ... confounding most of the people by failing to give a clear picture of its true direction. Resistance is holding, but support has developed. The market is caught between a rock and a hard place, and it has short-term work to do before bigger-picture trends can take a decided shape in either direction.
The S&P 500 (SPX) (SPY) makes this idea clear, without needing much explanation. The ceiling at 2064.5, from January, came back into play last week, capping Thursday's rebound effort and sending the index lower again on Friday.
S&P 500 - Daily Chart
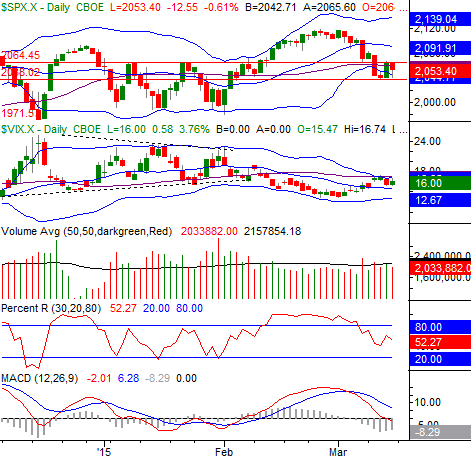
Chart created with TradeStation
The bulls shouldn't get too discouraged just yet though. Although the S&P 500 broke under the lower Bollinger band on Tuesday, a floor started to develop at 2040 and pushed the index at least back above the lower band line by Friday's close. Just as bullish is the way the CBOE Volatility Index (VIX) (VXX) was unable to get back above a pretty tough ceiling around 17.0, where its upper Bollinger band and 50-day moving average line have converged.
It doesn't guarantee a bounce is forming. It just gives the bulls a chance to make it happen. The bigger near-term undertow is still mildly bearish (falling MACD lines and a falling Percent R line), although it's worth noting the longer-term BigTrends TrendScore is still above the 60 mark. This tells us the bigger-picture trend is still technically a bullish one.
In other words, this environment is - for the time being anyway - one where traders may look to buy the dips in anticipation of a resumption of the bigger uptrend. It's not until the TrendScore slips below 40 that the bigger tide becomes a net-bearish one.
Zooming out to a weekly chart of the S&P 500 confirms the broad trend is still bullish, guided by a rising support and resistance channel. On the flipside, the S&P 500 still has room to fall within that rising channel before hitting the lower boundary.
Some of the detail is lost in the weekly timeframe, but the lower end of the channel now stands at 2000.
S&P 500 & VIX - Weekly Chart
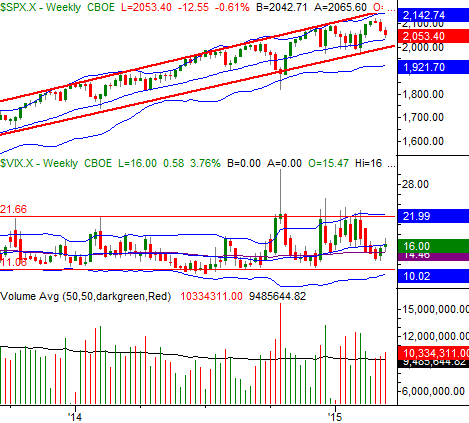
Chart created with TradeStation
If we drop further, keep an eye on the SPX lower 26-week Bollinger band currently at 1921.7. That's a "let's cross that bridge when we get to it" kind of conversation to table for the time being, though considering the VIX is still closer to the low end of its recent range than the high end, it suggests there's still room to go before fear hits a peak that would normally imply a bottom had been made.
This is a tricky situation to be sure, as stocks are squarely trapped between a rock and a hard place. Be cautious here about over-trading in this choppy environment and tighten holding periods in general. There are some clear and meaningful support AND resistance lines in view, most of which were discussed above . See how this plays out in the coming days/weeks/months.
Gold vs. the U.S. Dollar
Broadly speaking, most traders know the U.S. Dollar (UUP) is rallying and that the price of Gold (GLD) is back to its bearish ways of late. The scope of both of those trends, however, can only be described with/by a long-term chart. To that end, take a look at the graph of both below.
Gold Futures and U.S. Dollar Index - Weekly Chart
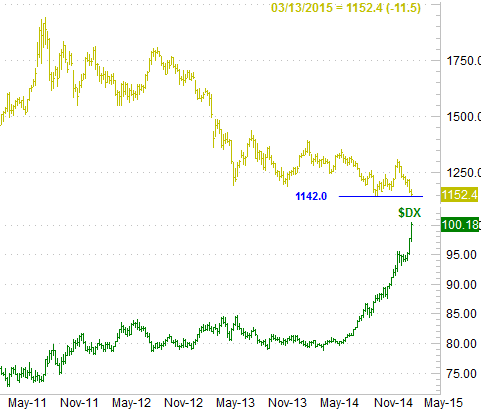
Chart created with TradeStation
If the dollar continues to rise, it seems likely that gold would break under its low of $1142/ounce from November and move on to new multi-year lows. On the flipside, if the dollar is in the midst of a parabolic move, that could correct sharply eventually.
Trade Well,
Price Headley
BigTrends.com
1-800-244-8736