Another January Swoon In Store? - Weekly Market Outlook
Another January Swoon In Store? - Weekly Market Outlook
Barring a big move on Monday, the end of 2014 and the beginning of 2015 isn't going to be the beneficiary of a so-called Santa Claus rally. The S&P 500 (SPX) (SPY) is now down 1.1% since the Christmas break, versus the average 1.8% gain we usually see during this period of the year.
That, however, isn't the only market worry at this point. More alarming is how much the last three months of 2014 looks like the last three months of 2013, which served as the basis for a rather bearish January of 2014 (the market lost about 5% last January before recovering).
We'll compare and contrast the two timeframes in question below, along with our unbiased look at what's going right and going wrong with stocks at this time. The first thing we want to take care, however, is a review of last week's key economic figures.
Economic Data
There wasn't a great deal of data in the lineup for last week, but a couple of items merit a closer look.
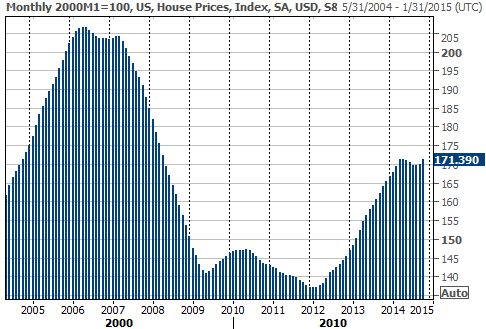
One of them is the Case-Shilller Index through October. It says home prices were up 4.5% as of the latest look, on a year-over-year basis. We're still nowhere near back to 2006's peak prices, and it would be a stretch to say home prices are heating up again after 2014's lull. October's advance was a glimmer of hope, though, possibly rekindling an uptrend.
Case-Shiller 20-City Home Price Index Chart
Source: Thomson Reuters Eikon
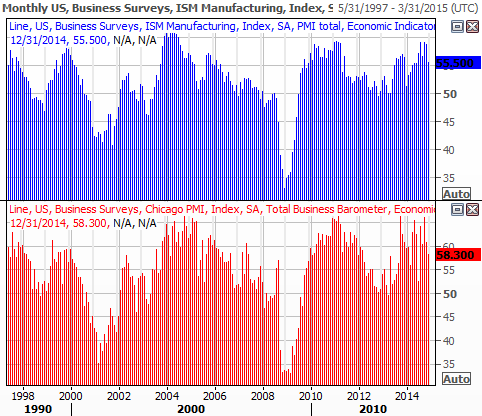
The Chicago Purchasing Manager's Index (PMI) and the ISM Index both remained in positive territory - above 50 - though both of them also peeled back from November's levels in December. Each is charted below.
PMI and ISM Indices Chart
Source: Thomson Reuters Eikon
Economic Calendar
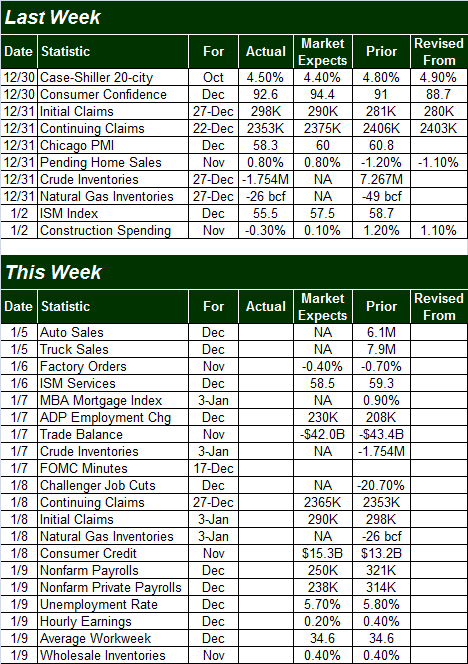
Source: Briefing.com
The coming week is going to be much busier on the economic front, though the bulk of this week's focus is going to be on December's employment numbers.
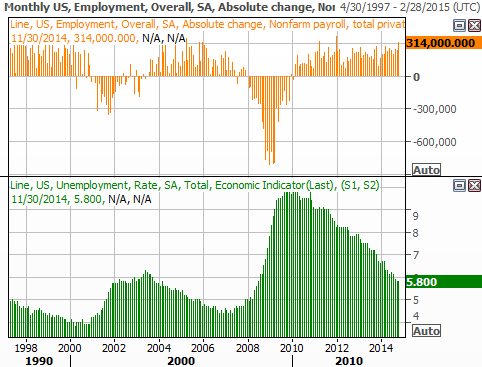
There's no denying the overall trend is getting better in terms of employment; our chart of all the relevant data through November verifies it. The pros expect more of the same kind of progress for December when the numbers are released on Thursday.
Employment Trends Chart
Source: Thomson Reuters Eikon
With all of that being said, don't forget the minutes from the Federal Reserve's most recent meeting will be posted on Wednesday. That could move the market as well.
Stock Market Index Analysis
The market may have managed to bounce back to a breakeven after Friday's fairly deep intraday dip, but it may be a little too soon to bet the farm on a near-term rebound. A decent amount of damage was done last week, and the indices are still just one bad day away from breaking under some pretty important support levels.
As the daily chart of S&P 500 below illustrates, the index went into selling mode on Tuesday, unable to hang on to its gains achieved as a result of the mid-December bounce. It's the second time in just a little over a month the market has been unable to hold up under the weight of its own rallies. Both peaks materialized right around the 2084 area.
S&P 500 & VIX - Daily Chart
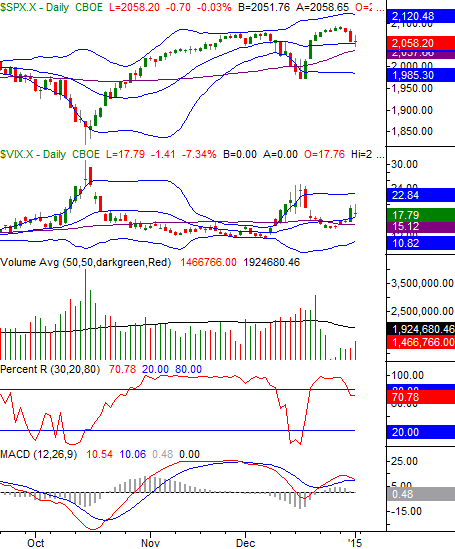
Chart created with TradeStation
Other red flags include a PercentR indicator that's fallen below 80 (although this could be considered a possible bullish 're-test' on that indicator), a MACD indicator that could dole out a bearish MACD divergence early this week, and a CBOE Volatility Index (VIX) (VXX) that's acting like it wants to push up and off its 20-day moving average line.
Nevertheless, the S&P 500 is on the bullish side of the most important short-term directional indicator... the 20-day moving average line (blue) at 2052.9. The index moved below it briefly on Friday, but as was noted above, the bulls pushed back above the 20-day line when push came to shove near Friday's close.
While we have to assume the bigger uptrend is intact until we break under the 2052.90 level (and really, until we break under the 50-day moving average line at 2037.7), a long-established pattern suggests a pullback is more likely to be in the cards than is easily seen in the daily timeframe.
Take a look at the weekly chart of the S&P 500 to see this pattern. The index has been capped by a rising ceiling (red) since early 2013, peeling back each time it was touched. The most common floor for retreats from that ceiling were the 26-week moving average line, currently at 1998.3.
S&P 500 & VIX - Weekly Chart
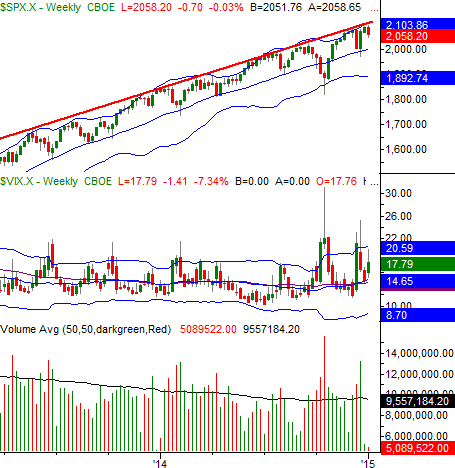
Chart created with TradeStation
All the same, the likelihood of a pullback is irrelevant until the support at the 20-day moving average line is breached. A decent bullish start this week would probably inspire a few days of bullishness, allowing the S&P 500 to test the upper 20-day Bollinger band, currently at 2120. It's all in how the ball gets rolling early this week, as January is notorious for big moves. Most of them are bullish, though some are bearish. Most of them though - whichever direction they're pointed - are significant. That's why this week's start is apt to be a critical clue. To that end...
Buckle Up
While every month of the year has the occasional wildly bullish or wildly bearish swing, January is far more apt than other months to post an extreme move. Yes, the average move in January since as a 1.01% gain, but the average loss is a whopping 3.65%, while the average gain is a hefty 4.18%. That qualifies it as one of the market's most "all or nothing" months.
And for what it's worth, of the past 64 years, January has doled out gains 39 times, and has lost ground 25 times. That's about the norm, but considering the current month is so often used as a barometer for the market's full-year performance that same year, one would expect bullishness at least a little more than 61% of the time.
January Stock Market Returns Table, by Year (Up vs. Down)
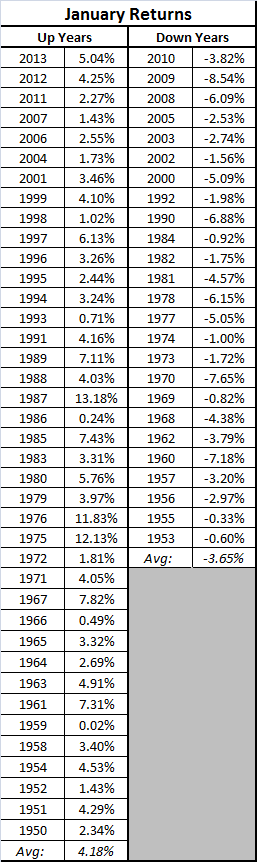
Source: MoneyChimp.com
Trade Well,
Price Headley
BigTrends.com
1-800-244-8736