Crude Oil Retracement Pattern Is Historically Strong, But Also Historically Near Limits
Crude Oil Retracement Pattern Is Historically Strong, But Also Historically Near Limits
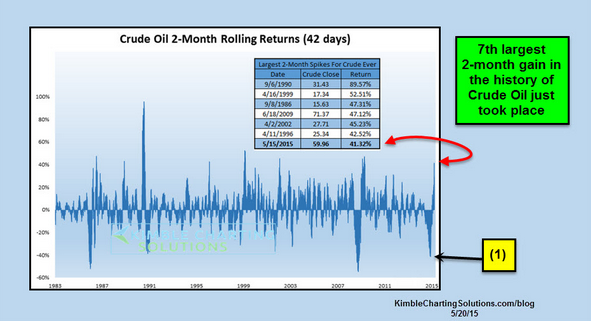
Crude oil - 7th largest 2-month rally in history, now what?
by Chris Kimble
Two months ago, the 2-month rolling return for Crude Oil (USO) was -40% at (1) below. At that time Crude Oil had declined almost $70 in the past 9-months, trading near $45. It was easy to find people predicting that Crude Oil was not near a low and some shared it was on its way to the $20 range.
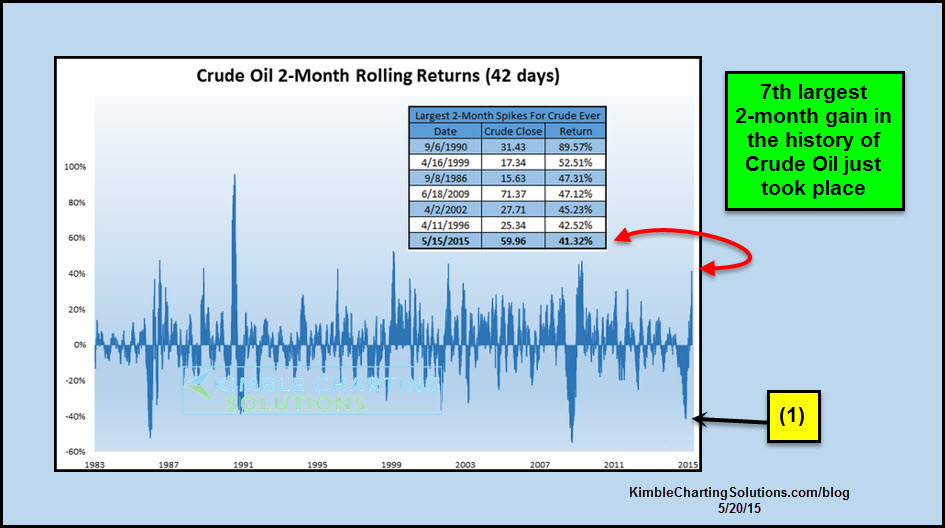
On March 31, the Power of Pattern shared the chart below at See It Market, reflecting that only 8-times in history had Crude oil created a 10% reversal pattern after a 40% decline in 12 months and the average gain 12-months out was 50%.
At the time Crude made the monthly reversal pattern (bullish 10% wick) it was trading at long-term support, which provided a good place for a rally to take place.
The top chart reflects that Crude Oil in the past 2-months has gained 41%, which is the 7th largest 2-month rally in its history. Think about this...the average gain for Crude Oil after creating the bullish reversal pattern was 50% in the following 12-months. In the past 2-months Crude has gained 41%, which is 80% of the normal one year gains!
Bottom line here... Bullish reversal wicks at support can provide good entry points and surprise the majority of investors. Crude Oil traders now might want to be a little more cautious since the rally over the past two months has been historically large!
Courtesy of philstockworld.com