S&P 500 Sector Weightings Analysis
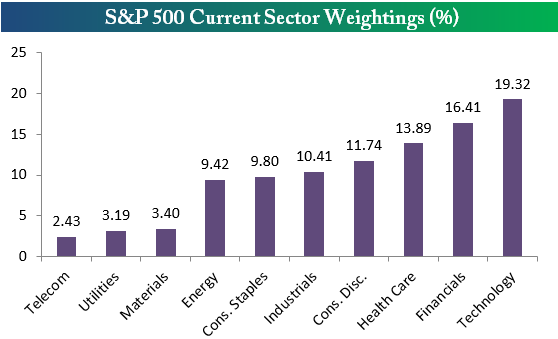
Below is an updated look at sector weightings for the S&P 500 (SPY) (SPX). As shown, Technology (XLK) remains the largest sector of the market at 19.32% -- pretty much a fifth of the market. The Financial sector (XLF) is the second largest with a weighting of 16.41%, followed by Health Care (XLV) at 13.89%. Consumer Discretionary (XLY) ranks fourth at 11.74%, Industrials is in fifth at 10.41%, and Consumer Staples (XLP) is sixth at 9.80%. The Energy sector (XLE) currently has a weighting of 9.42%, which is down significantly this year. The bottom three sectors (Materials (XLB), Utilities (XLU), Telecom (XTL)) make up just 9% of the index, so together they don't add up to Energy's weighting in seventh place.
S&P 500 Current Weighting By Sector
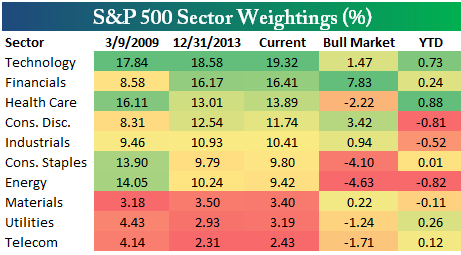
Below is a look at how sector weightings have changed during the current bull market as well as so far in 2014. Ironically, the two sectors that have seen their share of the market drop the most in 2014 are Consumer Discretionary and Energy -- two sectors that you wouldn't expect to move in line with each other. Industrials (XLI) has also seen its weighting drop this year, down 0.52 percentage points from 10.93% to 10.41%.
The three sectors that have seen their shares increase the most this year are the three largest sectors of the market -- Technology, Financials and Health Care. So the "rich have gotten richer" in 2014.
During the current bull market, the Financial sector has seen the biggest increase in share gain at 7.83 percentage points. It had dropped all the way down to 8.58% at the lows of the financial crisis after it was the largest sector of the market at the peak of the 2002-2007 bull cycle. Consumer Staples and Energy have seen the biggest drop in share during the current bull, both giving up more than 4 percentage points of share.
Sector Weighting Change Table
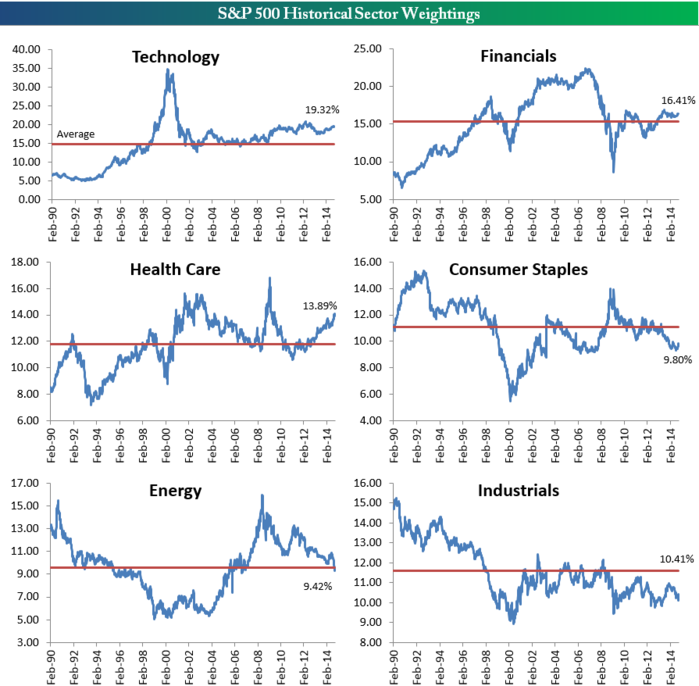
Below are long-term charts of sector weightings for the S&P 500. The red line represents the sector's average weighting going back to 1990. This allows you to see which sectors are currently above or below their long-term averages.
As shown, both Technology and Financials are back above their long-term averages, with Tech at nearly 4.5% above. Health Care is also quite a bit above its average, while Consumer Staples and Industrials are well below. Both Consumer Discretionary and Energy have now dropped below their average weightings after the rough patch they have experienced in 2014.
S&P Sector Weightings Long-Term Charts
Courtesy of bespokeinvest.com