One Divergence That Is Possibly Worrisome For Stocks
One Divergence That Is Possibly Worrisome For Stocks
"Strength lies in differences, not in similarities." - Stephen Covey
Technical analysts who study price movement often look at divergences between indicators and price action to see if a coming change in trend is likely. The basic idea is to try to identify something happening to price movement which is not immediately visible by looking at a chart. In the realm of inter-market analysis, divergences generally are not looked at from the standpoint of indicators on a security, but rather disconnects between and across various asset classes and sectors.
One of the hallmarks of this bull market in stocks has been the tight movement of equities and the behavior of bond credit spreads. There is an old saying that credit tends to lead equities both up and down. Credit-spread narrowing means default premiums are getting reduced, something which one should see in a bull market. The other side of that is when credit spreads widen, indicating concerns near-term about default rates. That is precisely the kind of movement that happens within the bond market when corrections and bear markets defined by heightened volatility persist.
There has been vicious "V-"shaped in equities in the past few weeks, but not credit spreads. Our model incorporates Stocks , Utilities (XLU) and Treasurys (TLT) as inputs used in our models for when to rotate between Treasurys and equities in order to try to generate an uncorrelated absolute return stream, have remained skeptical as internal weakness still remains beneath the surface.
Don't believe me that something is wrong about this "V," unlike prior ones for the S&P 500 Index?
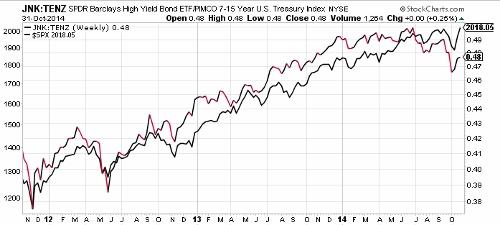
Take a look below at the price ratio of the SPDR Barclays High Yield Bond ETF (JNK), relative to the PIMCO 7-15 Year Treasury Index ETF (TENZ), shown in black and red. Overlayed against that price ratio is a chart of the absolute price of the S&P 500 SPDR ETF (SPX) (SPY). When the JNK/TENZ ratio rallies, it means credit spreads are narrowing (healthy). When it falls, it means credit spreads are widening (not healthy). Note that credit spreads led equities higher, up until very recently. The JNK/TENZ ratio has nowhere near rallied in magnitude as much as the broader market.
SPY vs JNK/TENZ Ratio Chart
This, I believe, is the only divergence that matters, and may be the real canary in the coal mine for a year-end rally. This is happening at the same time Treasury yields remain near the lows of the year, and as the Federal Reserve pulls back on stimulus. Could the vicious "V" in equities end up being one helluva headfake as credit fails to confirm?
[BigTrends.com note: While there has been a correlation in this Bond ETF Ratio and the SPY in the time frame of this chart (since late 2011), there is not a guaranteed set-in-stone performance correlation between Junk Bonds, the 10 Year Treasury, and the S&P 500. And while the recent underperformance versus this SPY is a bit concerning on that chart -- in a broad sense, they are both still uptrending and look pretty correlated to the eyeball test. And the latest 'bearish' crossover of the 2, for example, was in June, and the market is nicely higher since then (with some volatile swings). But it is something to keep in mind going forward.]
Divergences only die when people start noticing them, and act accordingly...
Courtesy of MarketWatch.com