Key Metrics & Valuations From Earnings Season
by FactSetInsight
Earnings Scorecard: Of the 230 companies that have reported earnings to date for Q2 2014, 76% have reported earnings above the mean estimate and 67% have reported sales above the mean estimate.
Earnings Growth: The blended earnings growth rate for Q2 2014 is 6.7%. The Telecom Services (IYZ) sector is reporting the highest earnings growth for the quarter, while the Financials (XLF) sector is reporting the lowest earnings growth for the quarter.
Earnings Revisions: On June 30, the estimated earnings growth rate for Q2 2014 was 4.9%. Six of the ten sectors have higher growth rates today (compared to June 30) due to positive earnings surprises, led by the Health Care (XLV) sector.
Earnings Guidance: For Q3 2014, 32 companies have issued negative EPS guidance and 15 companies have issued positive EPS guidance.
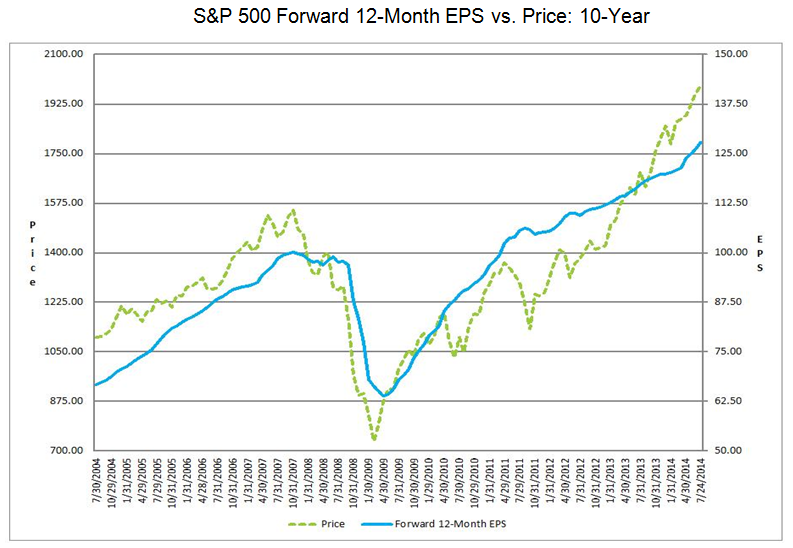
Valuation: The current 12-month forward P/E ratio is 15.6. This P/E ratio is based on Thursday’s closing price (1987.98) and forward 12-month EPS estimate ($127.71).
S&P 500 Forward 12-Month EPS vs. Price: 10-Year Chart
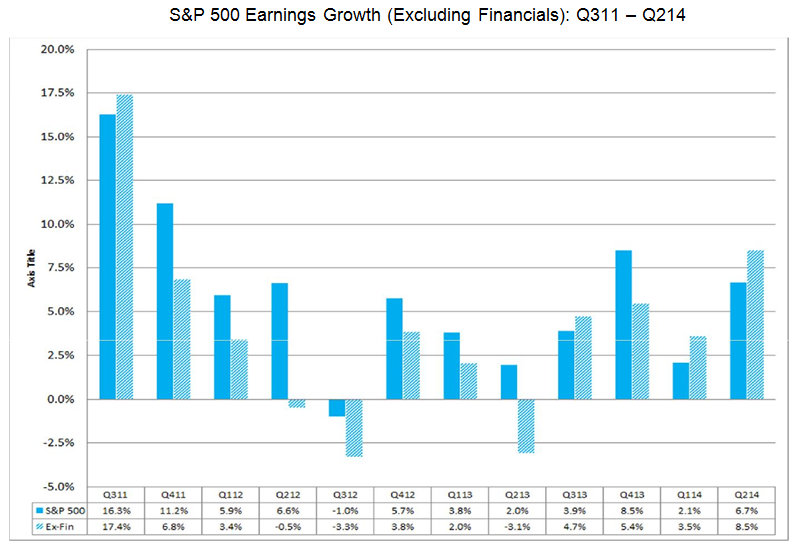
Highest Ex-Financial Earnings Growth Rate (8.5%) since Q3 2011
During the past week, the blended earnings growth rate for the S&P 500 increased to 6.7% from 5.4% due to a high number of companies reporting earnings above EPS estimates. Six of the ten sectors recorded an improvement in earnings growth over the past week.
However, one sector is still reporting a slight year-over-year decline in earnings growth for the second quarter: Financials (-0.4%). If the sector does report a decline, it will mark the second consecutive quarter that the sector has reported a year-over-year drop in earnings. Much of the weakness is coming from the Banks (KBE) (KRE) industry (-9%), as Bank of America (BAC), Citigroup (C), and JPMorgan Chase (JPM) all reported year-over-year declines in EPS for the quarter.
Given the earnings weakness in the Financials sector for Q2, how much would the earnings growth rate for the index improve if the Financials sector was excluded? How does the “ex-Financials” earnings growth rate compare to recent quarters?
If the Financials sector is excluded, the blended earnings growth for the remaining nine sectors would be 8.5%. If the final percentage for the quarter is 8.5%, it would be the highest earnings growth rate for the S&P 500 excluding the Financials sector since Q3 2011 (17.4%).
S&P 500 Earnings Growth (Excluding Financials): Q311 – Q214 Chart
courtesy of FactSet.com