Key Gold Technical Levels & Big Volume In Ultra Gold Miners ETFs
Key Gold Technical Levels & Big Volume In Ultra Gold Miners ETFs
Major Buy Signal in the Precious Metals Sector in the Next 2 - 3 Weeks
By Toby Connor
It's been my opinion for the last several weeks that Gold (GLD) formed an intermediate degree bottom on December 31. That being said, I'm still a bit nervous that the sector could suffer another manipulation event (like the flash crash two weeks ago) so I haven't been willing to enter a firm long position just yet.
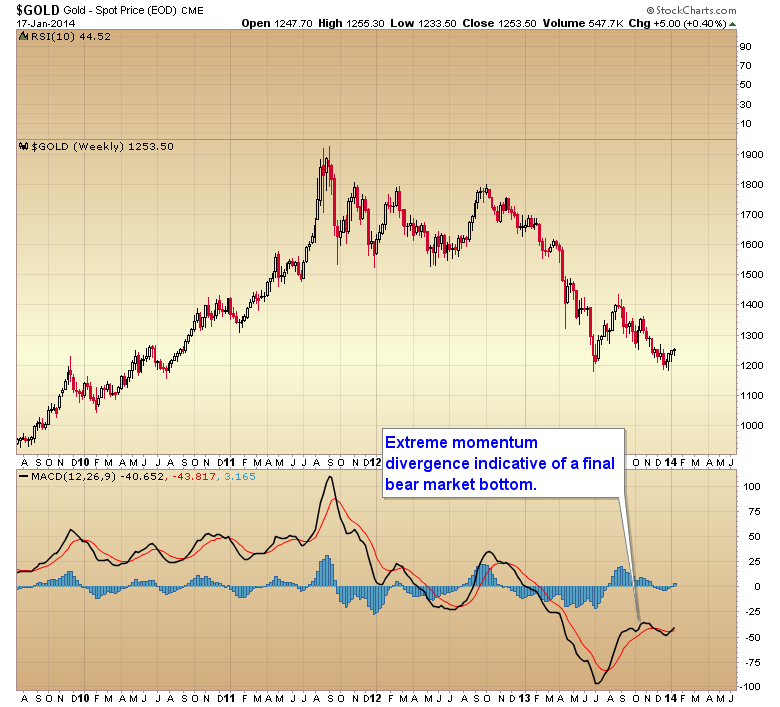
However there are definite signs that this bear market is probably over. The large momentum divergences on the weekly charts are one, see below:
Gold Weekly Chart
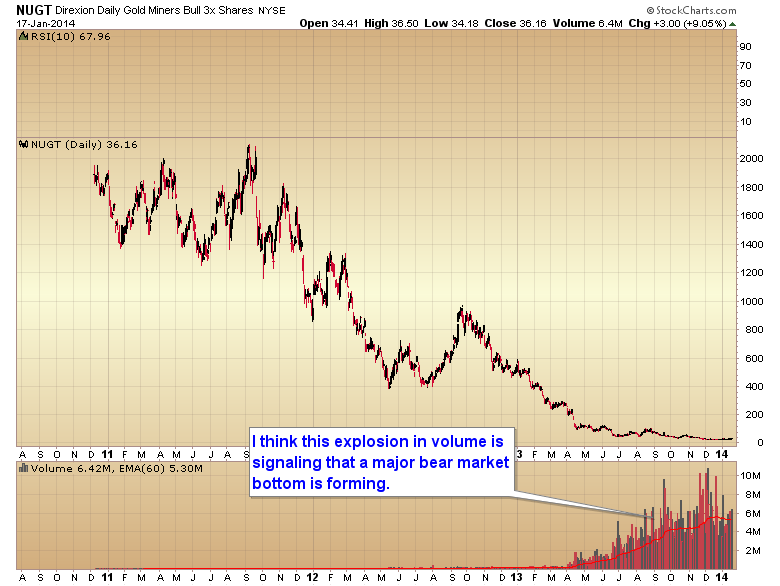
The heavy volume flowing into the Ultra Gold Miners Bull 3x ETF (NUGT) is another sign that smart money is positioning for a major bear market bottom:
NUGT Daily Chart
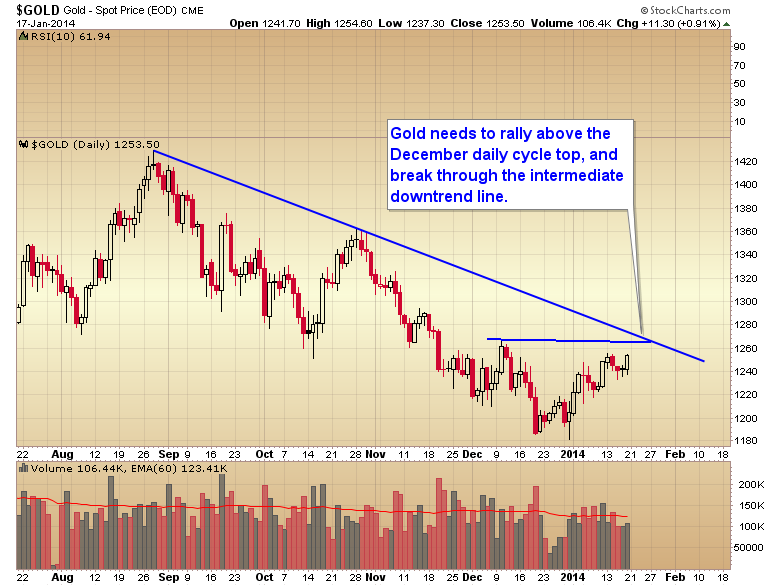
Presently I'm waiting to see if gold can break through the intermediate downtrend line and make a higher high above the previous daily cycle top. This would confirm the intermediate bottom.
Coincidentally this is roughly the same number in both cases. Gold will need to move above $1268:
Gold Daily Chart
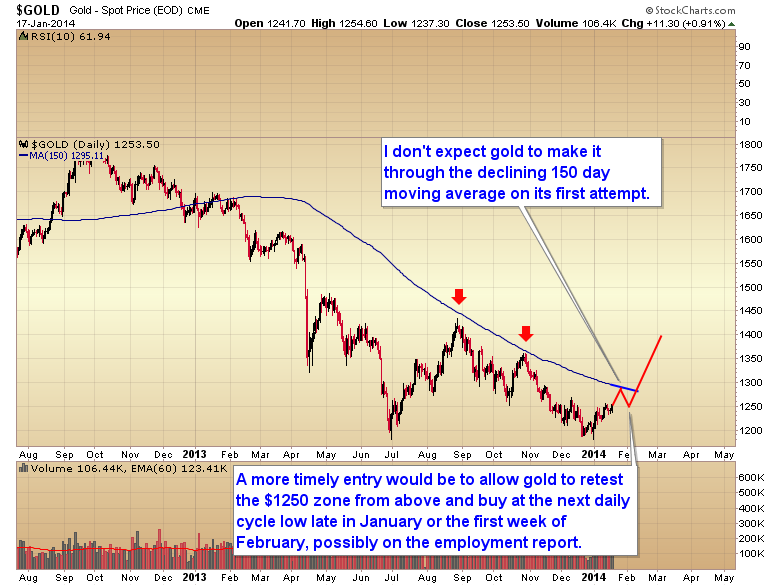
I would caution that a move above $1268 probably isn't a timely entry into the sector however. As gold is going to be moving into the latter part of its daily cycle timing band by the end of next week, a better strategy would most likely be to allow gold to bounce off of the 150 day moving average and then retest the $1250 level from above at the next daily cycle low:
Gold Daily Chart
So I think a little patience is warranted over the next two weeks. Allow gold to confirm the intermediate degree bottom. If it does, then prepare to buy aggressively at the next short-term pullback.
Courtesy of Toby Connor, GoldScents