Contrarian Alert: Over Past 2 Months, Lowest Rated Stocks Crushing Highest Rated Ones
Contrarian Alert: Over Past 2 Months, Lowest Rated Stocks Crushing Highest Rated Ones
Not a Good Year for Wall Street Analysts Either
by BespokeInvest
2014 has so far been an extremely difficult year for stock market investors. As noted by Goldman Sachs yesterday, "nearly 90% of large cap growth mutual funds and 90% of value funds were underperforming their benchmarks year-to-date." We would bet that the numbers are similar for small cap and midcap mutual funds as well as a large number of hedge funds. Performance like this doesn't just happen in a normal market environment. After a 2013 that saw Tech (XLK) and Consumer Discretionary (XLY) go up by 30-40%, investors came into 2014 overweight all of the areas that had shown strength, and underweight the sectors that had been lagging. Over the last two months, we have seen the most heavily owned and followed sectors like Technology and Consumer Discretionary go down, while under-owned sectors like Utilities (XLU) have been charging higher. Not many funds are fully invested in Utilities and other defensive plays, especially after the year we had in 2013. Given that the broad market has remained flat year-to-date even as the overweighted sectors have fallen, it's easy to see why so many are underperforming.
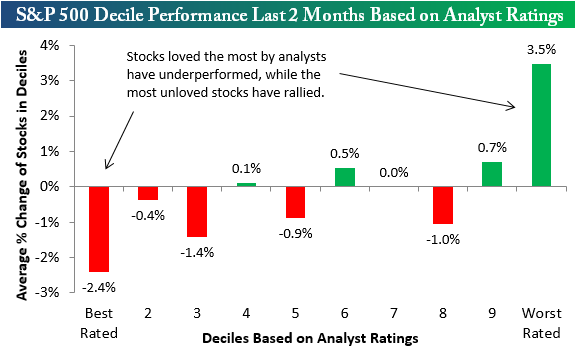
Wall Street analysts haven't exactly helped investors recently either. Below we have broken up the S&P 500 (SPX) (SPY) into deciles (10 groups of 50 stocks each) based on analyst ratings. Decile one contains the 50 stocks that are the most loved by analysts (most buy ratings vs. sell ratings), while decile ten contains the 50 stocks that are the most hated by analysts. For each decile, we have calculated the average performance of its stocks over the last two months going back to March 5th, which was the day the Nasdaq peaked.
Stock Performance By Analyst Rating

As shown below, the 50 stocks in the S&P 500 that have the most positive analyst ratings are down an average of 2.4% over the last two months, while the 50 stocks that have the most negative analyst ratings are up an average of 3.5%! That's a pretty huge difference, and it certainly helps in part to explain why so many investors are underperforming. Lots of fund managers and individual investors (especially) rely on the analysts at their brokerage firms for individual stock ideas. As is evidenced by the performance data below, owning the most loved stocks has been a losing trade in the current market environment.
Courtesy of BespokeInvest
