Weekly Market Outlook - Will The Post-Brexit Rally Continue?
Weekly Market Outlook - July 5th, 2016
Despite the horrific start on Monday, the bulls were decidedly in charge over the course of the last four days of last week, setting up a weekly gain of 5.1% for the S&P 500 (SPX) (SPY). The index is almost back to where it was before the Brexit vote shocked the world... for better or worse.
To that end, it's interesting (though not entirely surprising) that the rally started to slow on Friday. Perhaps it was just a small wave of profit-taking in front of a long weekend. Or, perhaps the market is right back in the thick of a valuation concern it was facing before the Brexit vote; we know there's a technical hurdle ready to hold any further rally effort back.
We'll slice and dice it all below. First though, let's back-track and look at some of the key economic news that may have gotten lost in the shuffle.
Economic Data
Not only was last week's economic calendar on the thin side, what little we got was shoved into the backseat as pros and amateurs alike were sorting out the Brexit impact. Since it will matter sooner or later though, a quick look at last week's key numbers is merited. In order of appearance...
While it wasn't leaps and bounds better than expected, Tuesday's third and final reading for Q1's GDP growth rolled in at 1.1%, versus expectations for 1.0% growth. Not bad. Of course, much of the current headwind we're feeling right now didn't develop until the second quarter, and the Brexit fallout won't have an impact until the third quarter. Still, 1.1% is serviceable IF the broad downtrend isn't an omen.
GDP Growth Chart
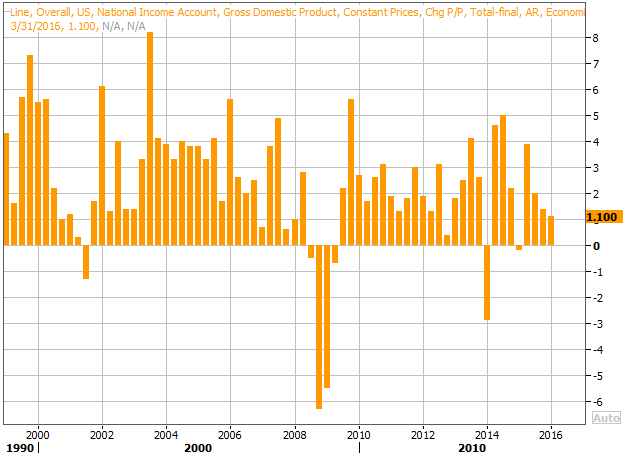
Source: Thomson Reuters
Also on Tuesday we heard June's consumer confidence score, as measured by the Conference Board. The reading of 98.0 was much better than the forecasted 93.1, and quickly quells a developing downtrend. The Michigan Sentiment Index fell slightly last month, but as the chart shows, it's recently found new strength as well.
Consumer Sentiment Chart
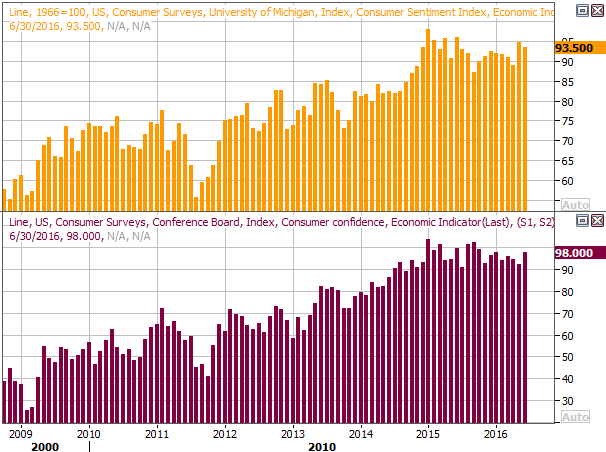
Source: Thomson Reuters
Everything else is on the following grid:
Economic Calendar
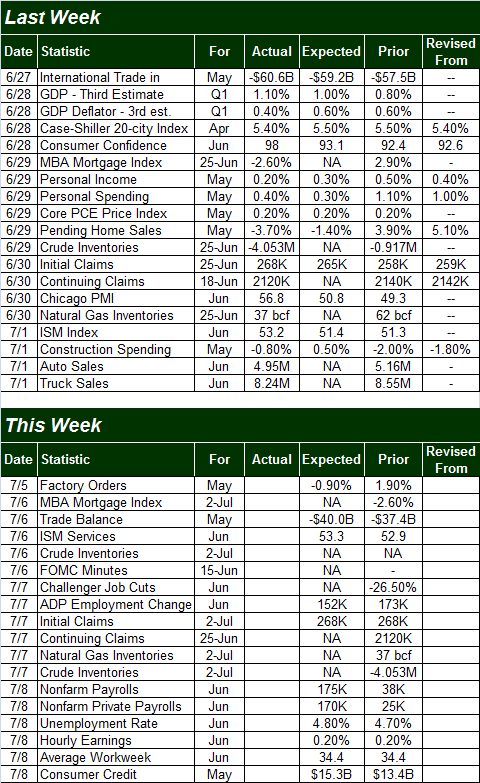
Source: Briefing.com
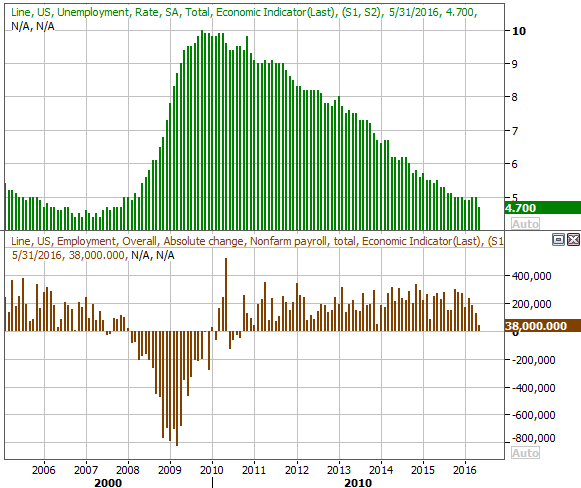
This week will be a bit busier than last week, but the proverbial big Kahuna is also the grand finale... Friday's employment report for June.
Analysts are calling for a remarkable increase in job-growth relative to May's anemic 38,000 new payrolls, though the expected 175,000 new jobs isn't earth-shattering (we'll take anything that's at least modestly better though). Even so, the pros are saying the unemployment rate will actually rise from 4.7% to 4.8%. In this case that's something of an indirect sign of improvement, indicating more and more people are looking for a job... whether or not they're actually getting them.
Payroll Growth, Unemployment Rate Chart
Source: Thomson Reuters
Look for Thursday's ADP employment change number as an omen of what to expect on Friday.
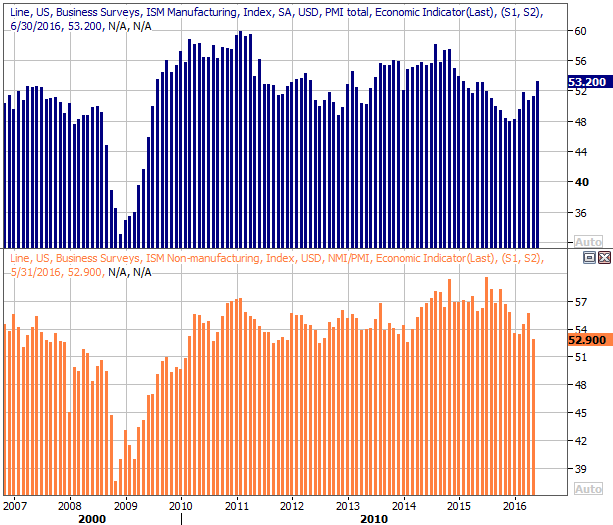
Before any of that though, look for the ISM picture to be rounded out on Wednesday.
We actually got the first half of the data last week with the ISM Manufacturing Index report. It was good, growing from 51.3 to 53.2. This week economists believe the ISM Services Index will rise from 52.9 to 53.3. Any reading above 50 is supposed to be a positive one, but it helps to see them rise as well. The ISM is, but we'd like to see a reversal of the ISM Service Index's trend.
ISM Index Chart
Source: Thomson Reuters
Stock Market Index Analysis
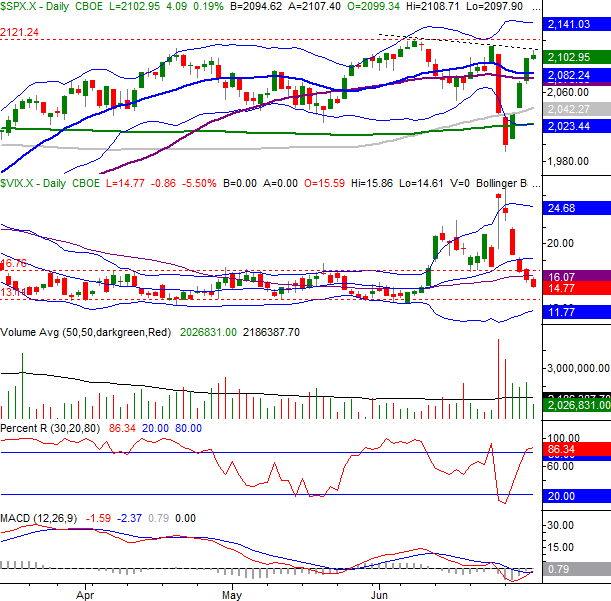
First and foremost, take everything you see and hear with a grain of salt. After the market was up-ended following the Brexit vote and then recovered beginning on Tuesday of last week -- a 5.3% swing -- anything can happen from here. Yes, last week was decidedly bullish, but if you look closely you'll see Friday's gain was a struggle. The bulls look like they may be running out of gas. In fact, go ahead and take a look.
S&P 500 & VIX Daily Chart
Chart created with TradeStation
Interestingly, Friday's high ended up becoming a third node of a near-term (and falling) resistance line.
The momentum is bullish nonetheless. We've got a MACD crossover as of Friday, and the Percent R line is now above the 80 threshold. The CBOE Volatility Index (VIX) (VXX) also has some room to keep falling. For that matter, while the S&P 500 did end up stalling at a short-term resistance line, that's only a minor ceiling. The bigger ceiling is still June's peak at 2121, and then at the upper Bollinger band currently at 2141. Sheer euphoria may rekindle the buying this coming week, in the absence of any discouraging news.
The daily chart of the NASDAQ Composite (COMP) doesn't look all that different. That is, the composite has hurdled its key moving average lines, but immediately after doing so, the buying effort faded.
Nasdaq Composite & VXN Daily Chart
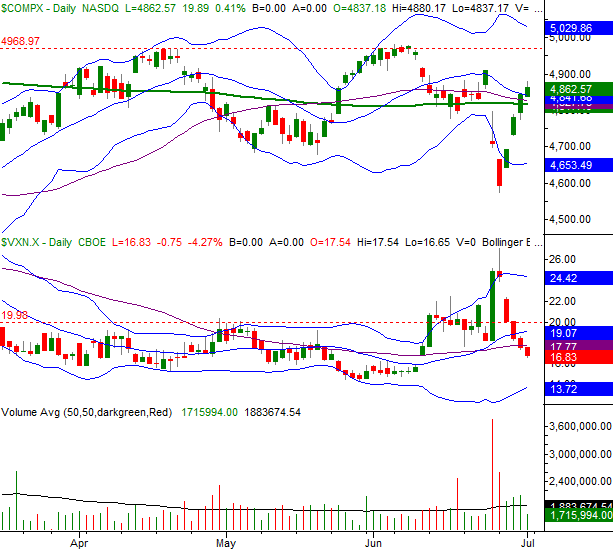
Chart created with TradeStation
Zooming out to a weekly chart of the S&P 500 we can gain much more perspective on what's going on here. Namely, we can see the short-term falling resistance line that developed in June didn't actually develop in June. It extends back to May of last year, and has been touched several times. We should take it seriously.
S&P 500 & VIX Weekly Chart
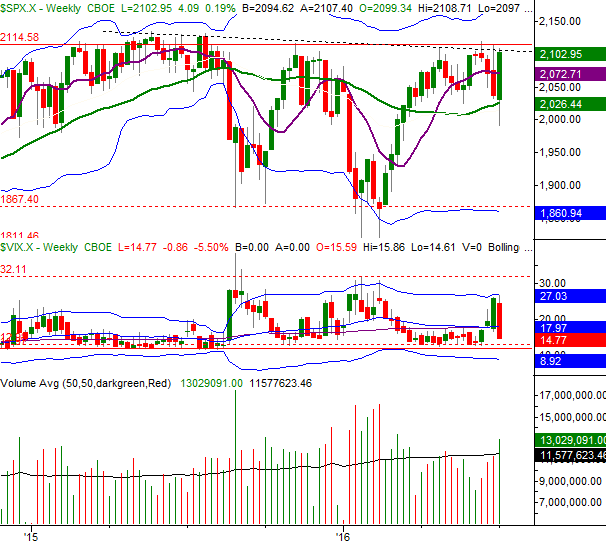
Chart created with TradeStation
Even so, last week's bar was a clear outside-day reversal... a decided change of heart that often marks the beginning of a respectable rally. With just a little more bullishness, the S&P 500 could break a HUGE ceiling at 2115 and race into new-high territory. Of course, with the VIX knocking on the door of a huge floor at 11.8, such a move would have something of a time limit.
The moral of the story: We need to be ready for anything this week, especially with the beginning of Q2's earnings season upon us. Speaking of....
Q2 Earnings Outlook
As of the latest look, analysts collectively expect the S&P 500 to report earnings of $28.32 per share for the second quarter of this year. That's an 8.3% improvement on the $26.14 worth of income reported for the second quarter of 2015, with the bulk of the planned increase coming from a slightly-sounder energy sector (XLE), and an overestimated healthcare sector (XLV). Everything from the second quarter on is an estimate.
Quarterly Earnings Growth by Sector
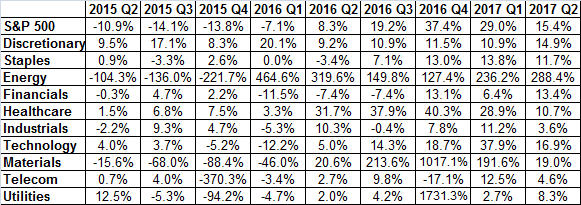
Source: Standard & Poor's
If the S&P 500 earns that projected amount, then the S&P 500 is currently priced at a trailing P/E of 20.8. It would be the second quarter of consecutive earnings growth, if growth is indeed in the cards, reversing a long string of weakening earnings. All the same, it would take a strong Q3 to really say the earnings downtrend had been reversed.
S&P 500 Earnings History, Outlook Chart
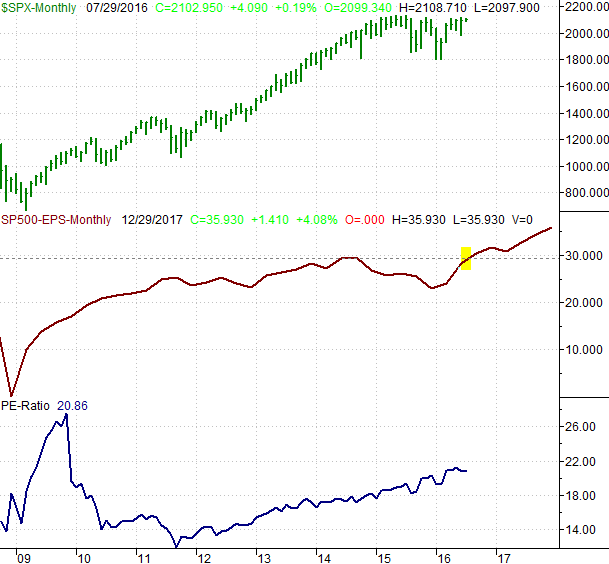
Chart created with TradeStation
Trade Well,
Price Headley
BigTrends.com
1-800-244-8736