Weekly Market Outlook - June 20, 2016
The bulls did everything they could to get the rally back on track last week after the early breakdown. But, it just wasn't meant to be. Once the S&P 500 (SPX) (SPY) fell under the 50-day moving average line on Wednesday, the index -- despite trying -- just couldn't climb back above it. When all was said and done, the market lost 1.18% of its value last week.
Still, stocks have a few rabbits they could pull out of a hat and move higher rather than losing any more ground. And, even if they do, there's still a ton of support not too far below where the S&P 500 ended last week. We'll look at those floors after looking at the more important economic news from last week and this week.
Economic Data
Last week was loaded with economic news. We can't cover all of it, but we will hit the highlights in orders of appearance.
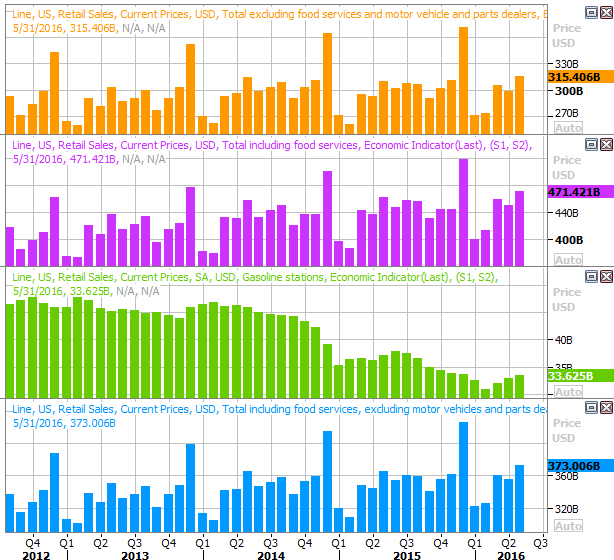
The first biggie came on Tuesday... May's retail sales figures. They were solid, up 0.5% overall, and up 0.4% when taking automobiles out of the equation. Total consumer spending was up more than expected, thanks to cars. The only weak link on the retail sales front is gasoline stations (and we know why), but even there we've seen three straight months of rising sales.
Retail Sales Chart
Source: Thomson Reuters
Note that on a year-over-year basis, retail spending was up about 2.0% regardless of the stratification. There's no way of saying a lack of consumerism is a pitfall for the economy right now.
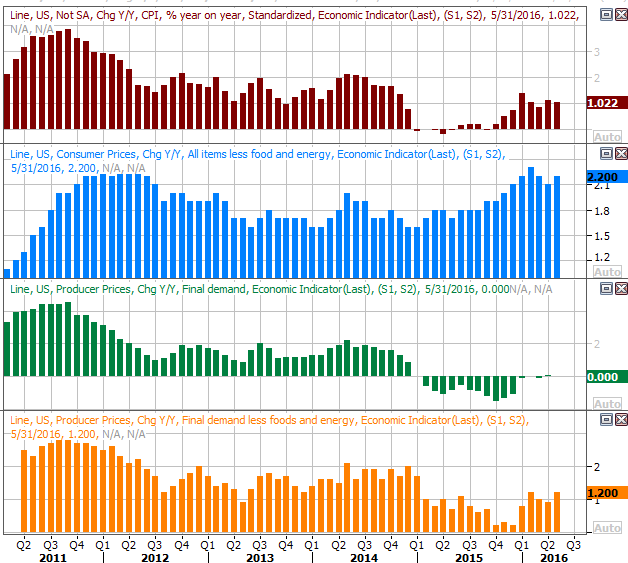
On Wednesday and Thursday we heard May's producer price inflation and consumer inflation numbers. On both fronts they were about as strong as anticipated, on a core as well as a non-core basis. On an annualized basis, overall consumer inflation stands at a rate of 1.0%, but on a core basis it's right around the Fed's target rate of 2.0% with a reading of 2.2%. Overall annualized producer inflation is stagnant -- at 0.0% -- and core producer inflation is a tame 1.2% on a year-over-year basis.
Inflation Chart
Source: Thomson Reuters
No matter how you slice it, inflation is under control, giving room to the Fed to wait on any rate hike. The only real justification for a rate hike based on the current inflation picture is the notion that it's rising. Janet Yellen may feel like she needs to quell it before it does race to debilitating levels. With not much else about the economy getting overheated though, even this "containment" argument feels a little flimsy.
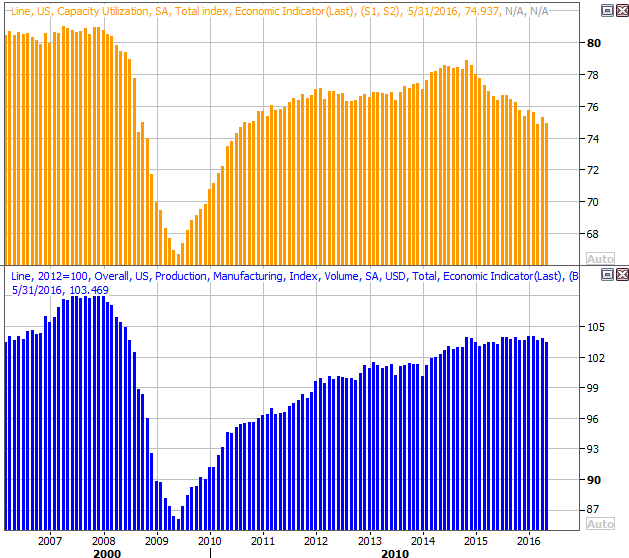
Also on Wednesday we got May's capacity utilization and industrial productivity report. These were already retreating, but with last month's contractions they've become an outright liability. Utilization rates fell from 75.2% to 74.9%, and production slipped 0.4%. Oil's demise may get the bulk of the blame, but it's starting to have a ripple effect on other parts of the economy. The downtrend for capacity utilization and the stagnation of industrial production has lasted a little too long now.
Capacity Utilization and Industrial Productivity Chart
Source: Thomson Reuters
Finally, on Friday we got May's housing starts and building permits. Starts were better than expected, and in line with April's starts. Permits fell a little short of estimates, but were a bit better than the reading from a month earlier. Still, as our longer-term chart of that data indicates, we're seeing a measurable slow-down on both fronts. That's not necessarily bad for real estate, but it is a red flag for residential construction stocks.
Housing Starts and Building Permits Chart
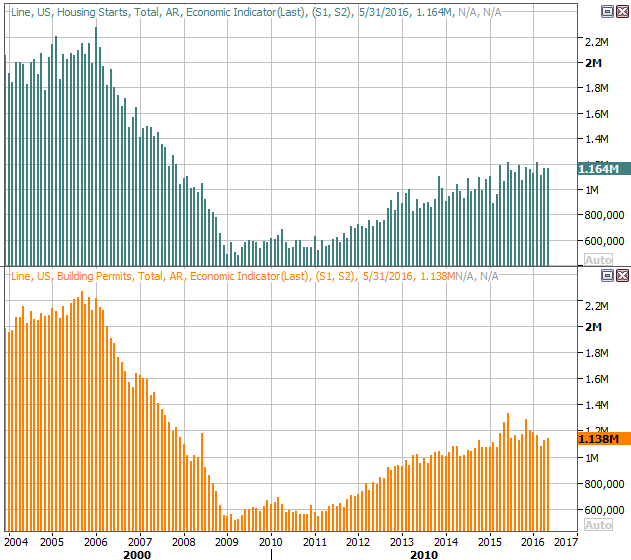
Source: Thomson Reuters
Everything else is on the following grid:
Economic Calendar
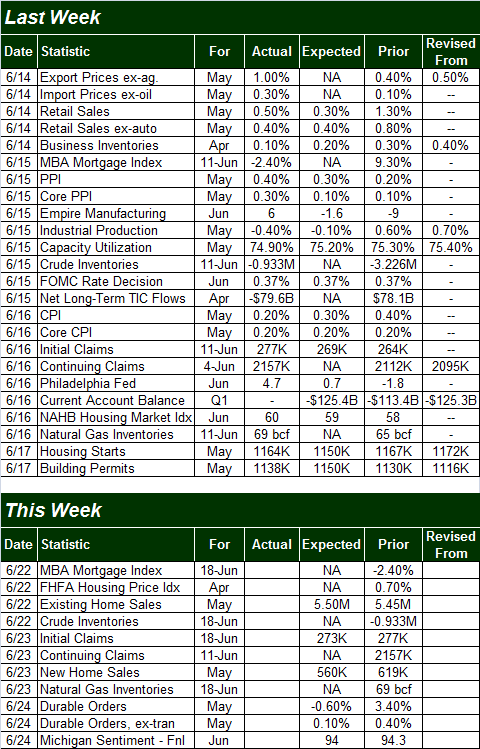
Source: Briefing.com
This week is going to be considerably lighter. The only items of real interest are May's existing home sales (on Wednesday), and new home sales (on Thursday). The pros say existing home sales should perk up a bit, but there's just no way the new home sales pace will be able to post a repeat performance of April's heroic pace.
New Home, Existing Home Sales Chart
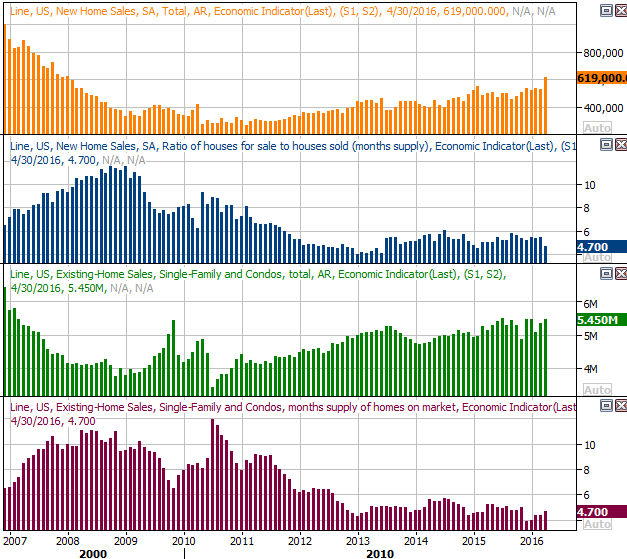
Source: Thomson Reuters
Despite slowing construction rates, the broad trend here on both fronts remains bullish. There's also a distinct lack of inventory, which is in conflict with slowing residential construction rates. One can't help but wonder if a lack of inventory is holding home sales back.
Stock Market Index Analysis
Last week, things got.... complicated.
There's no denying the bears were in charge, though that came as no surprise in light of the fact that the market marched into new multi-month high territory in early June, reaching unjustified valuations. Sometimes stocks simply give a false hint of a breakout only to set up a steep pullback. That looks like what happened last week.
And yet, there's just as good of a chance we've seen the last of the selling effort (for now) as there's a chance we'll immediately proceed to lower lows.
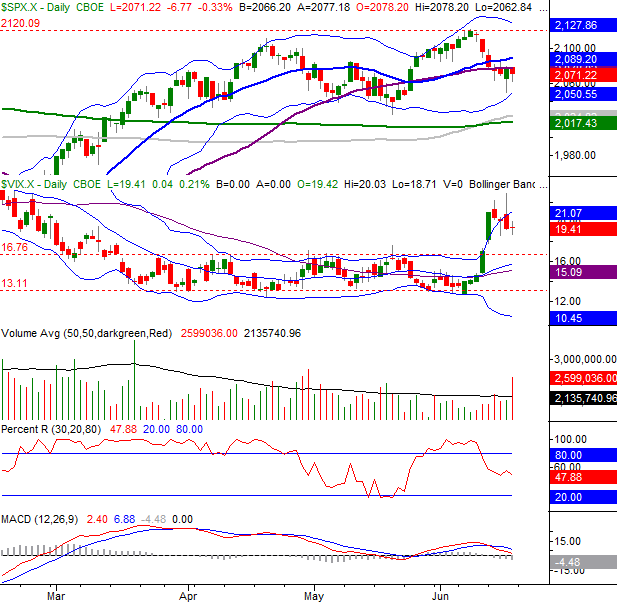
The daily chart of the S&P 500 below tells the wild tale. The index broke below the 50-day moving average line (purple) on Tuesday, but it wasn't any time after that beak down occurred that the bulls began trying to crawl back above that intermediate-term moving average line. They didn't succeed, but you can see how on Thursday and Friday the opens and closed were well above the lows, and hugging the 50-day average.
S&P 500 & VIX Daily Chart
Chart created with TradeStation
Perhaps more important is the way the VIX moved last week.
While Monday's strong upward thrust from the VIX built on the prior Friday's pop, in retrospect we can see it was simply too much, too fast. Sure enough, the VIX spent the remainder of the week peeling back -- which is bullish for stocks -- but there's still plenty of room for the VIX to keep falling.
This has been representative of the market's biggest headache for several months now... an all or nothing mentality, with traders unwilling to pace themselves. (That said, the frothy valuations haven't helped.)
To be clear, the current trend leans bearish. We're now standing in the shadow of a MACD crossunder, and there's no way of denying the S&P 500 is on the wrong side of its short-term moving average lines. It's a flawed, unconfirmed bearishness though. The Percent R line has yet to get AND STAY below the 20 threshold, and we have to respect the distinct possibility that the S&P 500's lower Bollinger band and/or the 100-day and 200-day moving average lines around 2020 could easily turn into support and rekindle the bigger rally effort. Plus, though it fell 24.5 points last week, the BigTrends TrendScore is still at 60.2, barely above the bullish threshold and twenty basis points above the level at which the reading slips into neutral territory. This is all very much an "on the fence" scenario, making this week a critical one.
Zooming out to a weekly chart of the S&P 500 offers a little more perspective on the current situation, although it doesn't necessarily help with getting a bead on what's next. The arching shape we've seen over the past few weeks says the index is rolling over right where it should... at a familiar technical ceiling. The VIX says the same with its push up and off the floor around 12.0. But, we can't ignore the fact that the S&P 500 closed well off its lows for last week, hinting that the bulls were already going fishing again even before the selling had a chance to get going in earnest.
S&P 500 & VIX Weekly Chart
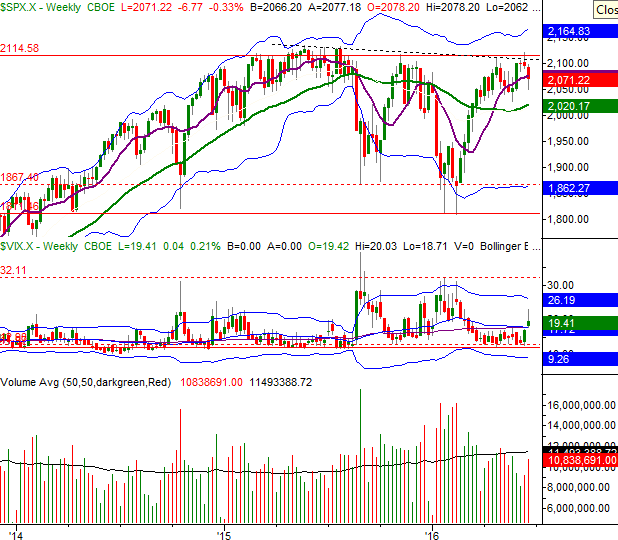
Chart created with TradeStation
The smart-money move here may to do simply wait for one side of the table or the other to tip their hand in a meaningful way. The picture's pretty obscured now, though that's not atypical for this time of year.
Crude Oil Done Correcting?
Finally, a quick look at one of the market's recent hot buttons.... crude oil (USO). The 62% runup from February's low to this month's high had some people convinced it was ready to suffer a more serious setback, but the pullback oil dished out last week and the latter part of the week before may have been all the correction crude needed to make. In fact, most signs say oil is already on the mend and back in an uptrend.
The chart of crude oil below tells the tale, and the corresponding chart of the U.S. Dollar Index (UUP) largely tells why. All it took was oil's brush of an established support line and the dollar's renewal of a bigger-picture downtrend to get oil going again. In fact, crude oil futures logged an outside day reversal on Friday, which indicates a major, sweeping change of heart.
Crude Oil, U.S. Dollar Index Chart
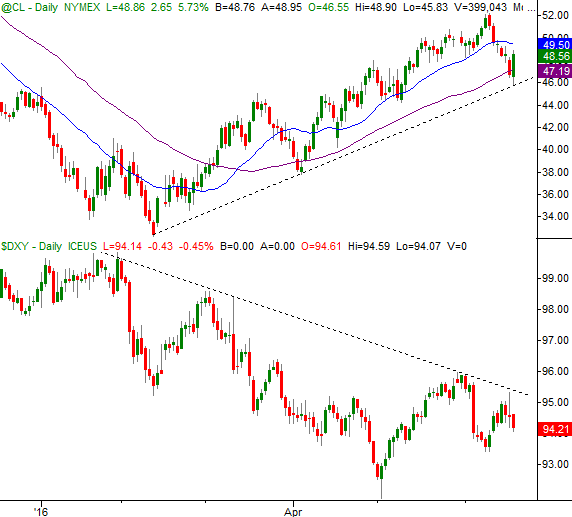
Chart created with TradeStation
Most of the clues here point to another round of bullishness for crude.
Trade Well,
Price Headley
BigTrends.com
1-800-244-8736