Weekly Market Outlook - Where We Stand As Fed Approaches & Earnings Season Is Underway
Weekly Market Outlook - July 25, 2016
Despite starting last week out overbought and near all-time highs, the bulls decided by the end of the week they were still buying more. Friday's close of 2175.03 was not only 0.6% higher than the prior week's close, it was a record high close for the S&P 500 (SPX) (SPY). No, it's not a giant gain, but it's an impressive one all things considered - however there are plenty of opportunities for profit-taking right now.
The $64,000 question: Can the current rally last? As John Keynes said it, the market can remain irrational longer than you can remain solvent. In other words, it can go further and faster than one might think -- and often, the trend is your friend.
On the flipside, while you can hope for the best, it never hurts to prepare for the worst. We'll look at both the bullish and bearish possibilities below, following a run-down of last week's and this week's economic news.
Economic Data
There wasn't a lot in the lineup last week, though it was a biggie for real estate...especially residential real estate.
The party started on Tuesday, with June's housing starts and building permits. Both were up, and both up by more than expected. And, one could say the broad uptrend is still intact. That uptrend, however, is slowing down. This could, and should, lead to slowing activity in the foreseeable future.
Housing Starts and Building Permits Chart
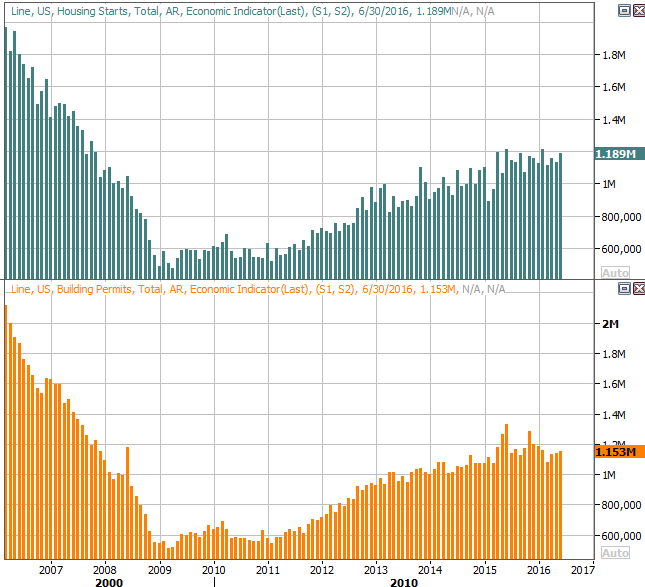 Source: Thomson Reuters
All the same, we rounded out the housing market's activity with a look at June's existing home sales. The pace of 5.57 million not only extends a long-term uptrend, but was also a new multi-year high. It's impressive, even if the starts and permits data says that progress will slow.
New, Existing Home Sales and Inventory Chart
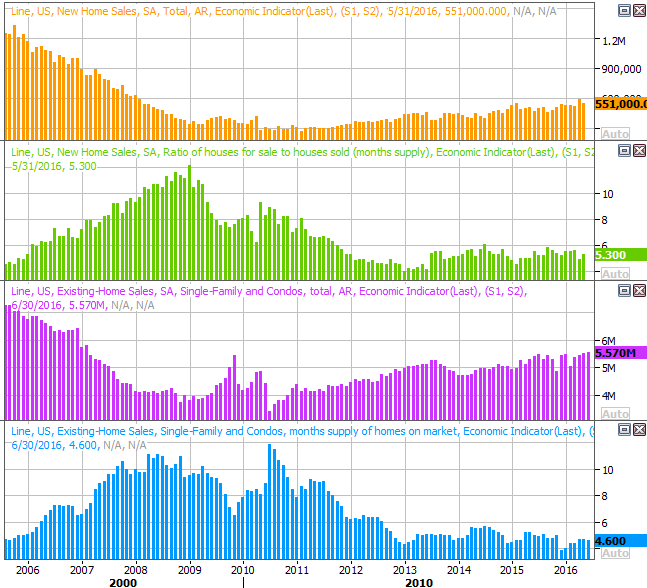 Source: Thomson Reuters
We'll get the new homes sales figure this week, though odds are good it too will continue its steady uptrend. Note that inventory of both new and used homes remain near multi-year lows, perhaps limiting purchase activity (though keeping prices firm).
Last but not least, no chart is necessary, but the FHFA Housing Price Index advanced 0.2% last month, also extending a long-term growth trend.
Everything else is on the following grid:
Economic Calendar
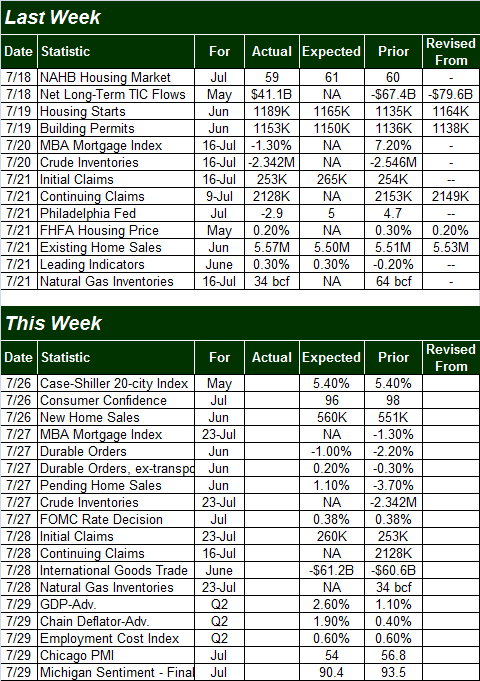
Source: Briefing.com
This week will be slightly busier, and further flesh out the real estate picture. Namely, we'll get new home sales on Tuesday. We saw on the chart above new home sales are trending higher, and are expected to edge a little higher again for June.
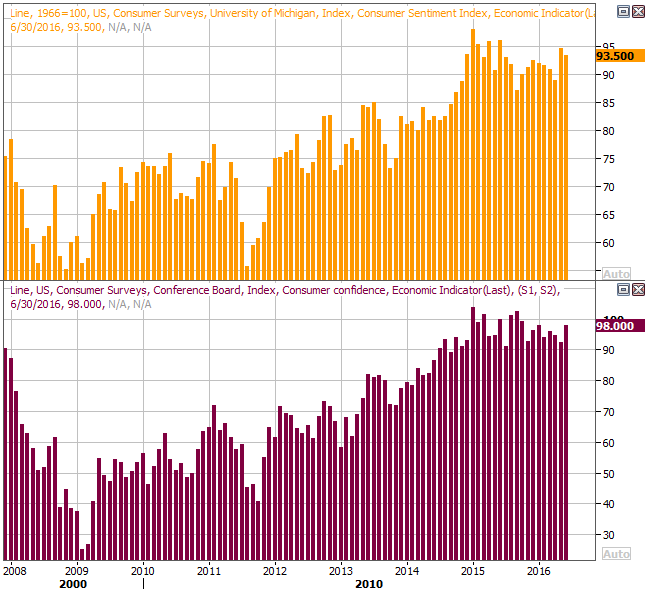
This week is also going to be a key one for consumer sentiment... the first such reading from the Conference Board since the Brexit decision. The pros say the consumer confidence score is apt to fall from June's 98.0 to 96.0. The Michigan Sentiment Index is projected to move from June's final score of 93.5 to a third and final reading of 91.5. Though down, the pullbacks are not frighteningly harsh.
Consumer Confidence Chart
 Source: Thomson Reuters
Of all the news that could move the market this week, though, it's the FOMC's rate hike decision -- and rhetoric -- on Wednesday that could do the trick. No change is expected, and if anything, economists expect the Fed to remain on the dovish side of the table.
Stock Market Index Analysis
It's not as if the bears didn't have plenty of opportunity to finally up-end the market. They just didn't use it. Or, perhaps the bulls didn't let them use it. While stocks are unusually overbought and overpriced right now, that doesn't necessarily mean the rally has to come to an end here.
Of course, there's no reason not to be alert for all possibilities.
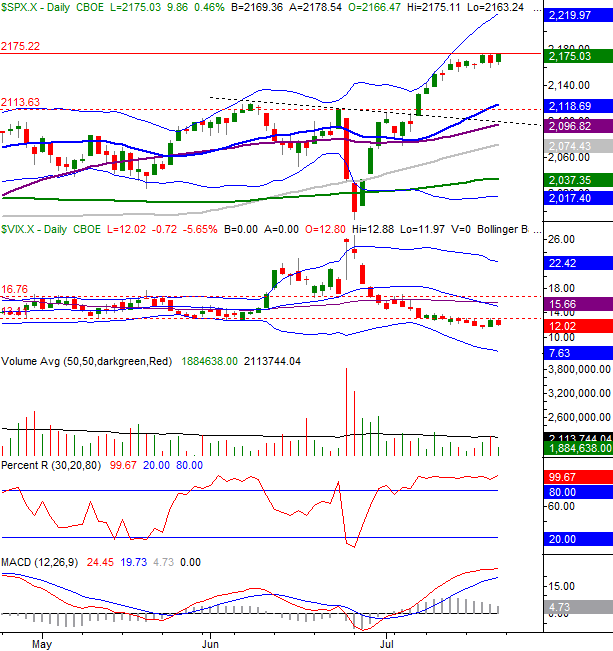
Take a look at the daily chart of the S&P 500 below. There's no denying the move since the post-Brexit, late-June low has been unusually strong, and quick. You can even see it slowing down with an arching, U-shaped rollover effort. You can also see, however, the index has yet to make a lower low to put the beginning-of-the-end touches on that rollover move. Indeed, the bulls finished last week back on the verge of breaking to higher highs after a brief, sideways move.
S&P 500 & VIX Daily Chart
Chart created with TradeStation
For a completely different perspective, check out the weekly chart of the NASDAQ Composite (COMP). It's on this chart we're reminded the tech-heavy NASDAQ isn't into new-high territory the way the S&P 500 is, and as such isn't running the same risk the S&P 500 is.
NASDAQ Composite & VXN Weekly Chart
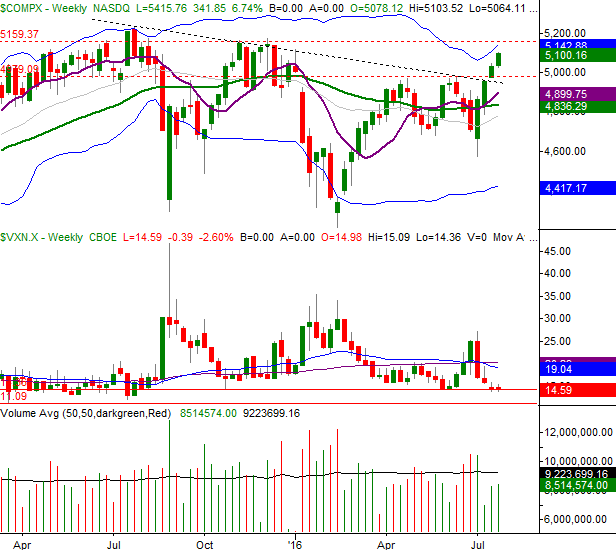
Chart created with TradeStation
The next big stop for the composite is the 5160 area, where the composite peaked in the last quarter of last year as well as a few times in the middle of last year. That's also where the upper 26-week Bollinger band will be this week. Also note that while the Nasdaq Volatlity Index (VXN) is already at one verified floor, the current reading of 14.59 could still moves to the mid-11's before reaching an absolute floor. It all leaves the NASDAQ about another 1.1% upside until really tough headwinds start to blow.
Point being, we can't rule out what seems unlikely here.
If the NASDAQ punches through the 5159 mark, that could prod at least a little more bullishness. If instead the weight of the recent runup proves to be too much, the most plausible floor for the composite is the 200-day line at 4836. For the S&P 500, the most likely floor is right around 2100.
Q2 Earnings Check-In
With 30% of the S&P 500's constituents now having reported their Q2 numbers, we can start to get a good feel for how the market as a whole did last quarter.
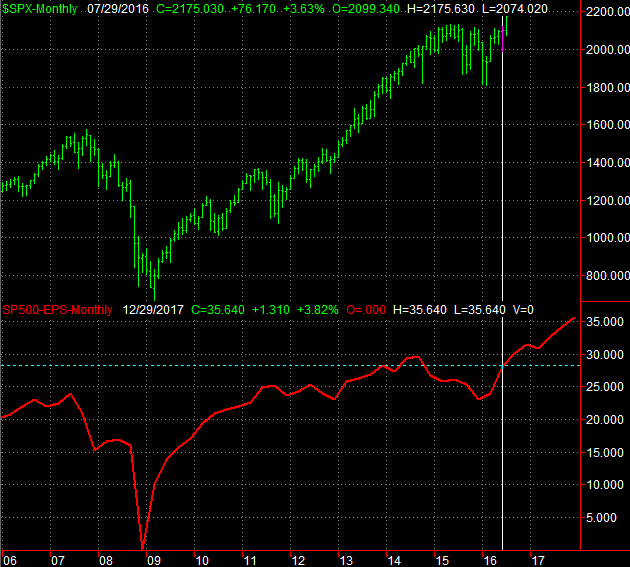
First and foremost, good news. The projected EPS of $28.04 as of two weeks ago for the S&P 500 has since been ramped up to $28.09. Q3's expectation of $30.33, however, has been pared back to only $30.11. Either way, those numbers represent 7.4% and 18.4% year-over-year growth, respectively.
S&P 500 Earnings Trend, Outlook
Data provided by Standard & Poor's
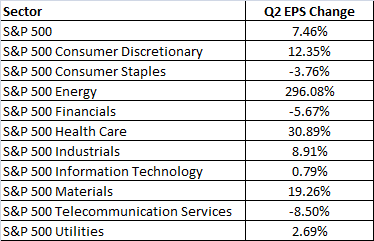
Don't get too excited just yet, though. The bulk of the turnaround was the swing to a profit (from a Q2-2015 loss) for energy stocks (XLE), and a similar big jump in earnings from materials stocks (XLB). Beyond that, most sectors have only mustered anemic year-over-year growth, if not posted year-over-year declines in income. The only truly impressive area has been consumer discretionary stocks (XLY), which thus far have managed to report a legitimate 12% growth rate in quarterly earnings. Healthcare (XLV) looks impressive too, but that 30% improvement in earnings is more outlook and less actual results. Only eight of about 50 healthcare stocks in the S&P 500 have reported their results yet.
S&P 500 Q2 Earnings Growth, by Sector
Data provided by Standard & Poor's
We'll update the second quarter earnings scoreboard as the numbers roll in.
Trade Well,
Price Headley
BigTrends.com
1-800-244-8736