Weekly Market Outlook - Valuation Concerns
Despite the wobbly start last week, the bulls took control again on Thursday and Friday to push the week back into the black. The move has yet to clear all the major hurdles that could prove to be technical problems, but at least things are pointed in a bullish direction.
On the flipside, stocks may have already walked back into a valuation headwind.
We'll weight it all below after taking a close look at last week's and the coming week's economic news.
Economic Data
Last week was pretty well packed with data, not the last of which was a snapshot of inflation (or lack thereof) picture. Low oil prices (USO) have kept inflation practically nonexistent for producers as well as consumers, but even taking food and energy out of the equation, inflation remains rather tame.
Inflation Rate Chart
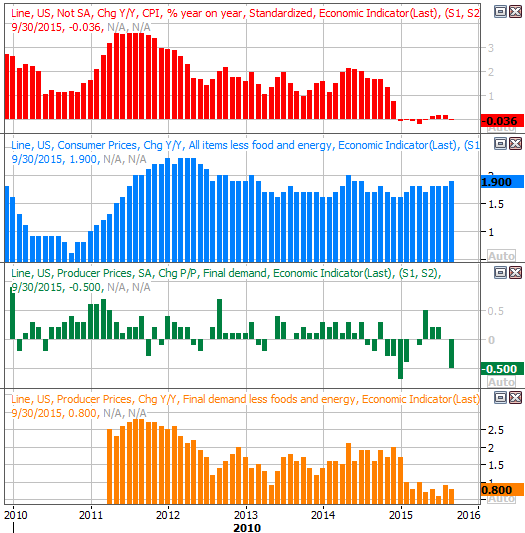
Source: Thomas Reuters
Retail sales (XRT) were better or worse than anticipated in September, depending on your perspective. Overall they grew 0.1% last month, versus flat expectations. But, taking automobiles out of the equation, they fell a hefty 0.3% versus expectations of only a 0.1% decline. Broadly speaking, retail sales growth has been tapering off for a few months.
Retail Sales Chart
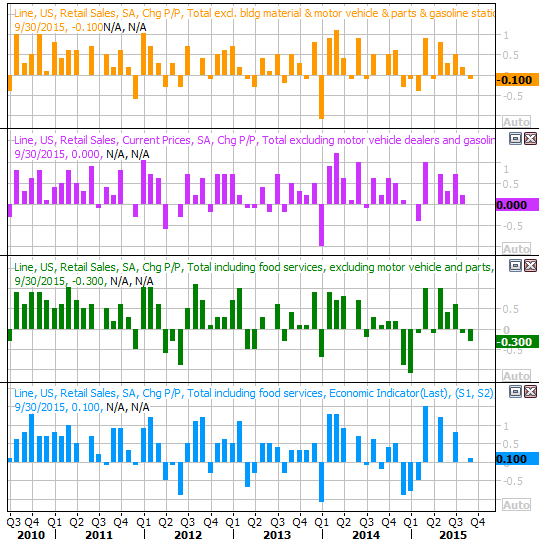
Source: Thomas Reuters
Last but not least, although capacity utilization is still deteriorating, actual production hasn't yet. Historically, both need to be in a decline to be of significant concern.
Capacity Utilization and Productivity Chart
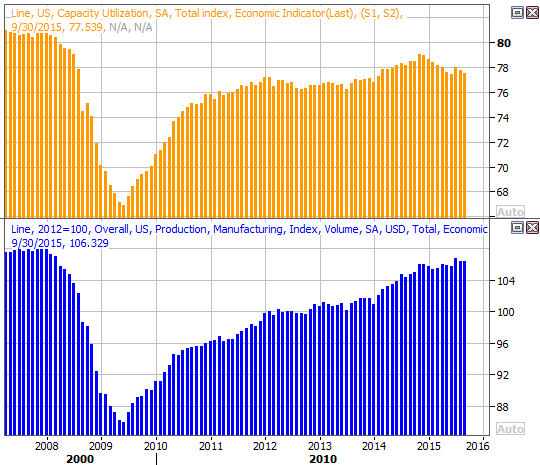
Source: Thomas Reuters
Everything else is on the following grid:
Economic Calendar
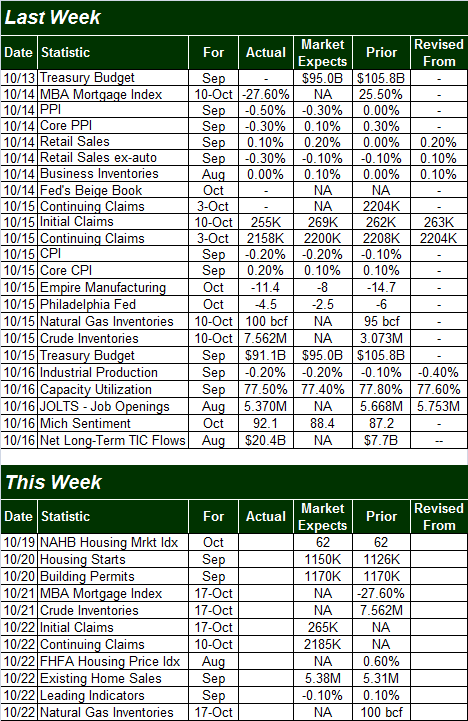
Source: Briefing.com
This week will be less busy. In fact, there's only one item of any real interest... Tuesday's housing starts and building permits (XHB). Both have been in bigger-picture uptrends, and economists expect sustained - even if not heroic - strength through September.
Housing Starts and Building Permits Chart
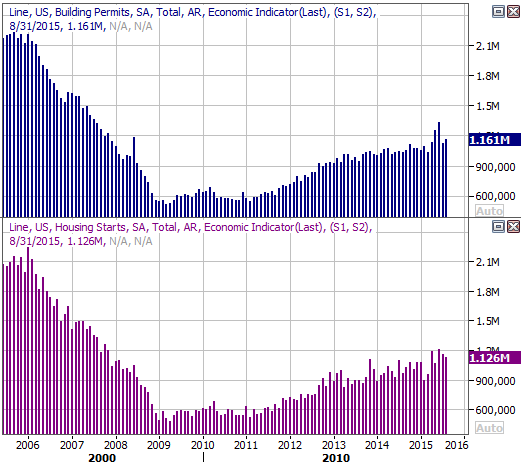
Source: Thomas Reuters
Stock Market Index Analysis
Technically speaking, the S&P 500 (SPX) (SPY) is officially in an uptrend. That doesn't mean it can't be snapped soon enough, but for right now, the bulls are decidedly in charge.
The confirmation for that rally comes from the recent shape of the Percent R line. Last week we discussed how a bull trend is confirmed by a Percent R line that crosses above the 80 "overbought" threshold, pulls back without falling back under 80, and then points upward again if-and-when the market makes a higher high. Well, as you can see on the daily chart of the S&P 500 below, this is exactly how things played out last week.
S&P 500 & VIX Daily Chart
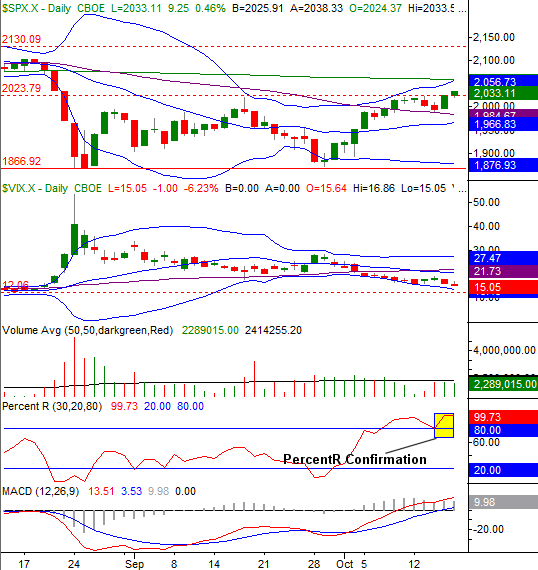
Chart created with TradeStation
Confirming the market's current bullishness is the fact that not only are both MACD lines now pointed upward, both are above the MACD zero line, suggesting this bullishness has actually been in place for a while and is well-established.
The same can't quite be said of the NASDAQ Composite's (COMP) daily chart below. That is, we don't yet have a Percent R confirmation yet, nor or the MACD lines both above zero. This is of modest concern, as the NASDAQ ideally leads the true trend rather than lags it.
NASDAQ Composite & VXN Daily Chart
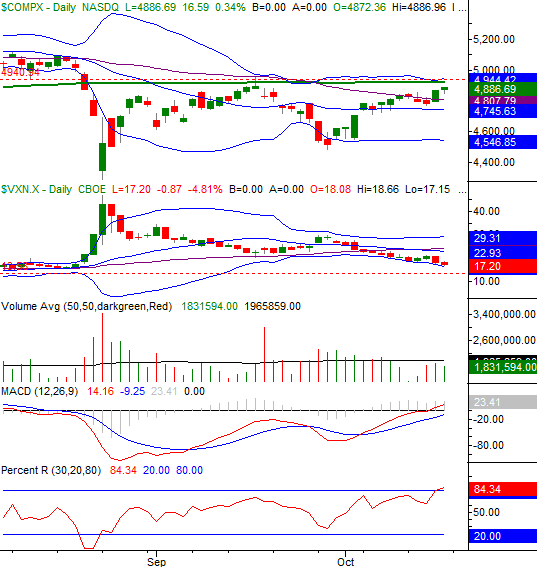
Chart created with TradeStation
On the other hand, this may all be a setup for the NASDAQ to play the role of the hero.
The composite has a massive resistance line dead ahead, at 4942, where several key technical indicators have converged. This is also where the NASDAQ peaked in early September. Clearing that hurdle now could have the effect of unleashing a great deal of pent-up buying that's been put on hold just because those would-be traders are waiting for a clear sign that the market is no longer stuck in a range.
Backing out to a long-term weekly chart of the S&P 500, it's becoming quite clear that the low of 1872 from three weeks ago was part of a rather important double-bottom pattern; there's still room to keep rallying too.
S&P 500 & VIX Weekly Chart
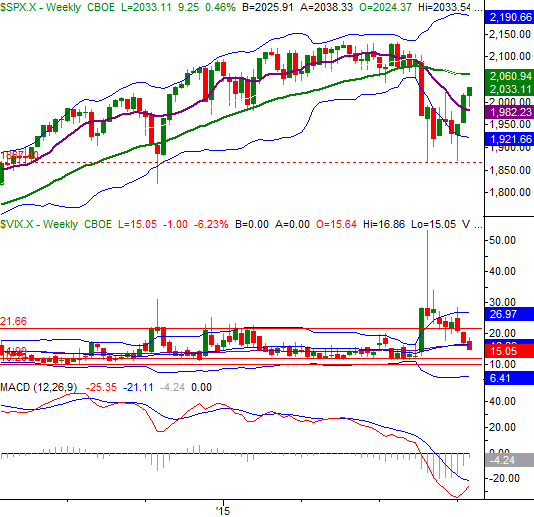
Chart created with TradeStation
The CBOE Volatility Index (VIX) (VXX) also has room to keep moving lower before finding a floor around 12.0, and then 10.5. That leaves a little room for more upside from stocks before hitting a sentiment headwind, though not a lot of room. Between that and the valuation headwind (more below) we're running into, the fourth quarter could prove to be choppy and unproductive after (or if) we break above the previously-mentioned technical ceilings. Don't misunderstand.... we could get a little bullish mileage out of a break above those resistance levels, but we may not get a lot.
Valuation Scenarios
Although our core focus is on technical analysis of the stock market, we cannot deny that its fundamentals - and the perception of their health - ultimately drive the broad market to its final destinations. To that end, now that third-quarter's earnings season is on full swing, a look at where we are and where we are expected to be in the foreseeable future is in order.
As of the latest look, the pros believe the S&P 500 is on pace to "earn" $28.77 per share for Q3. At that pace, the S&P 500 will have earned $107.47 for the past four quarters. This translates into a trailing P/E of 18.9... beyond the high end of the norm. The implosion of crude oil is the key reason earnings are lower by 6.1% on a trailing twelve-month basis.
On a forward-looking basis, the S&P 500 is expected to earn $123.64 for the coming four quarters (Q4-2015 through Q3-2016), and is expected to earn $127.88 in calendar 2016. This translates into a forward-looking P/E of 16.4 and 15.9, respectively.
It's this forward-looking valuation - which is counting on a big rebound in oil prices - supporting the current lofty valuations. But, that's clearly a dangerous assumption.
The projections are calling for the energy sector to expand 2015's bottom line by 192% better than 2015's likely earnings. On the other hand, even at the projected income levels for the energy sector, 2016's profit estimates for the coming year are still only about 40% of 2012's peak profits for the industry (In other words, it's do-able).
A decent recovery in the price of oil coupled with more big-time cost-cutting could conceivably push the oil and gas industry toward better numbers in 2016. That's a "have to perform" situation for the broad market's valuation though, as the Energy sector (XLE) alone normally contributes about 15% of the S&P 500's total earnings.
Trade Well,
Price Headley
BigTrends.com
1-800-244-8736