Weekly Market Outlook - Valuation Concerns As New All-Time Highs Approach
Weekly Market Outlook - July 11, 2016
Following through on the surprising post-Brexit bounce from two weeks ago, the S&P 500 (SPX) (SPY) gained 1.3% last week, closing at 2129.90. Though that wasn't the highest close ever for the index (nor did it reach a new intraday high), that was the highest weekly close ever for the S&P 500. And, we're within easy reach of the pinnacle of 2134.72 hit in May of last year.
This is a do-or-die moment for the market. If it's to muster any more upside, it's going to have to plow into new-high territory and traders are going to have to effectively say valuations aren't that important currently (a la 1999). It could happen though.
Or, this overvalued and overbought market could finally buckle under its own weight.
We'll weight the near-term odds below, after painting the bigger picture with last week's and this week's economic news.
Economic Data
Last week was chock full of economic news, but there's little doubt as to the highlight... June's employment report. Though it was the proverbial grand finale, calendar-wise, let's get to it first.
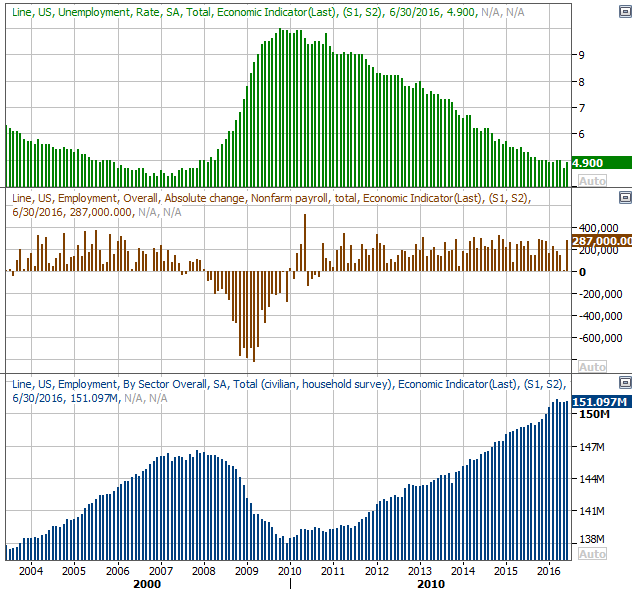
Bottom line? The U.S. added 287,000 new payrolls last month... the biggest increase since October of last year, putting the overall trend back on track. Don't get too excited though, as most of June's new jobs were taken out of May's report. We initially thought there were only 38,000 new jobs made in May, but after a closer count, the tally was only 11,000. The average for the two months is 149,000, which is right at the average for the past several months.
The unemployment rate ticked higher -- as expected -- from 4.7% to 4.9%, though in some regards that's a good thing. It indicates people are plowing back into the labor force (though not necessarily employed). This suggests they see enough good job opportunities to put forth a serious job search effort. Underscoring this idea is the reality that the total number of employed people ticked up from 151.03 million to 151.097 million, rekindling a long-term uptrend.
Employment Growth, Unemployment Rate Chart
Source: Thomson Reuters
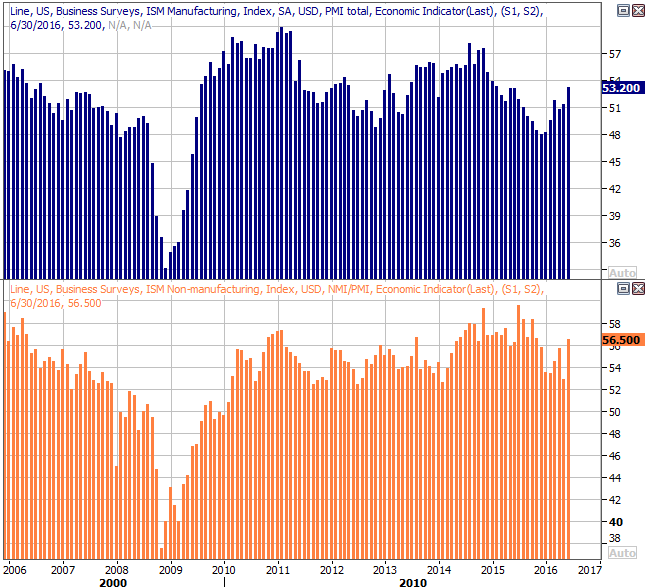
Jobs data wasn't the only noteworthy economic news to come out last week though. We also rounded out the ISM picture with the ISM Services Index score, which followed the ISM Manufacturing Index score from two weeks ago. The former ramped up from 52.9 to 56.5, while the latter grew from 51.3 to 53.2 in June. Any reading above 50 for each is positive, but it's encouraging to see both tick a little higher all the same. Better yet, each seems to be bolstering the uptrend.
ISM Index Chart
Source: Thomson Reuters
Everything else is on the following grid:
Economic Calendar
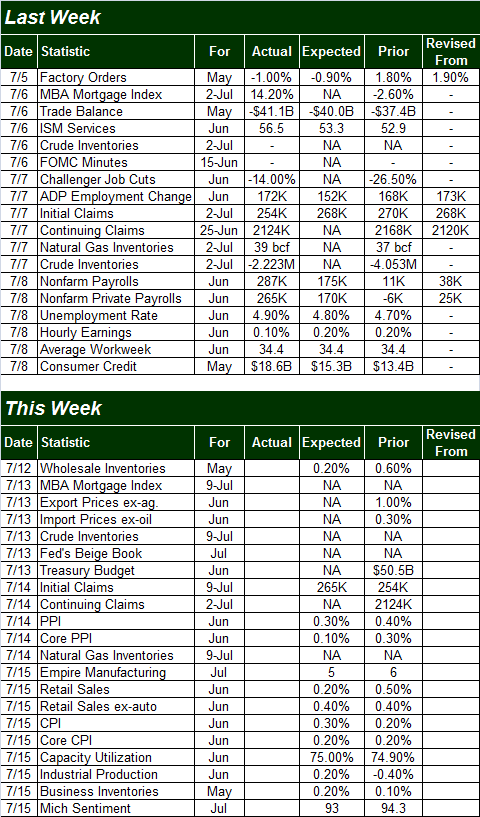
Source: Briefing.com
The coming week will be a bit busier, though only three items are of any major interest... inflation, retail sales, and capacity utilization/industrial production.
While both producer inflation and consumer inflation remain at tame levels, both inflation rates are on the rise. The current consumer inflation rate, not counting food and energy costs, stands at 2.2%. Producer price inflation -- again, without food and energy costs counted -- is 0.8%. Both are mostly on the rise. Yes, food and energy are cheap, but sooner or later both will become relatively more expensive. It will all have to be quelled soon, even if not immediately.
Consumer, Producer Inflation Chart
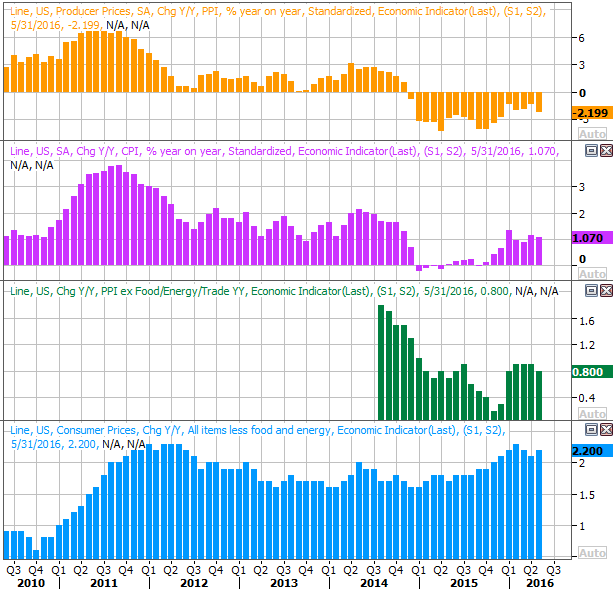
Source: Thomson Reuters
Retail sales are projected to edge a little higher, growing 0.2% overall, and growing 0.4% when taking the automobile sales lull out of the equation. Those advances will extend a long-term trend that's been impressive despite the adverse impact low oil prices have had on gasoline prices. People are spending what they're saving at the pump on other things.
Retail Sales Chart
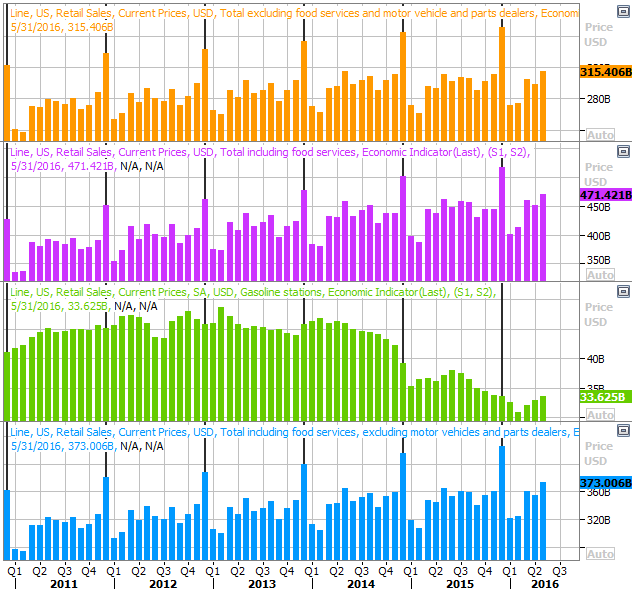
Source: Thomson Reuters
Finally, on Friday we'll hear June's capacity utilization and industrial productivity numbers. Economists are looking for modest increases on both fronts, which we desperately need. The energy sector's demise has been killing capacity utilization for a while but total production is also starting to roll over. Another bad month on that front could turn into a surprisingly big problem.
Capacity Utilization, Industrial Productivity Chart
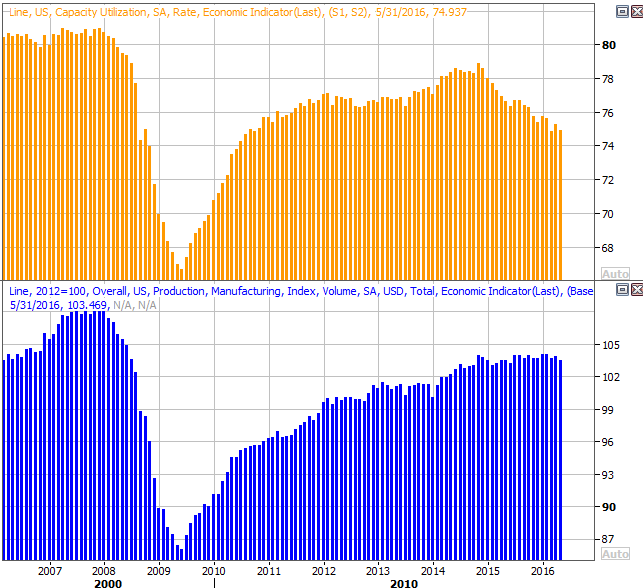 Source: Thomson Reuters
Stock Market Index Analysis
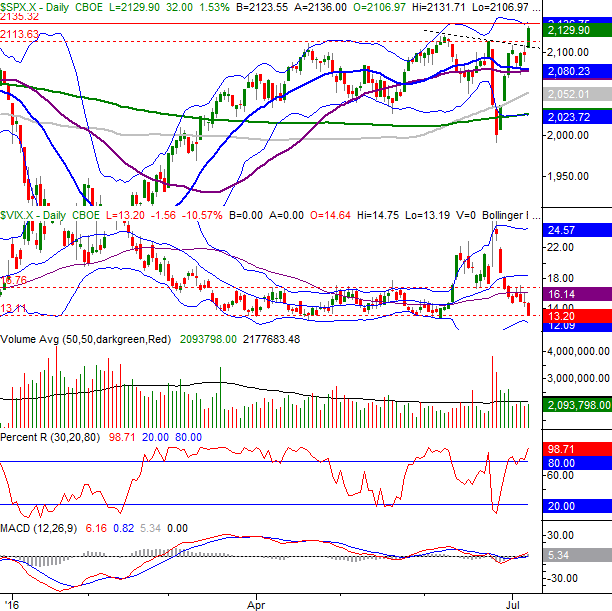
Let's start with the bigger picture first -- the weekly chart of the S&P 500 -- since it offers some much-needed perspective.
Clearly the bulls finally became willing to follow through on the big reversal bar from two weeks ago, pushing above a modestly-falling resistance line (dashed) and approaching the all-time ceiling at 2134.72. This is the quintessential breakout move, and under normal circumstances would be viewed as a reason to buy in. This is anything but a normal situation, however. As of Friday's close the S&P 500 is valued at a trailing P/E of 21.2 and a forward-looking P/E of 17.0, and the CBOE Volatility Index (VIX) (VXX) is back to an intermediate-term floor at 13.1 and also getting close to a long-term floor at 11.9.
S&P 500 & VIX Weekly Chart
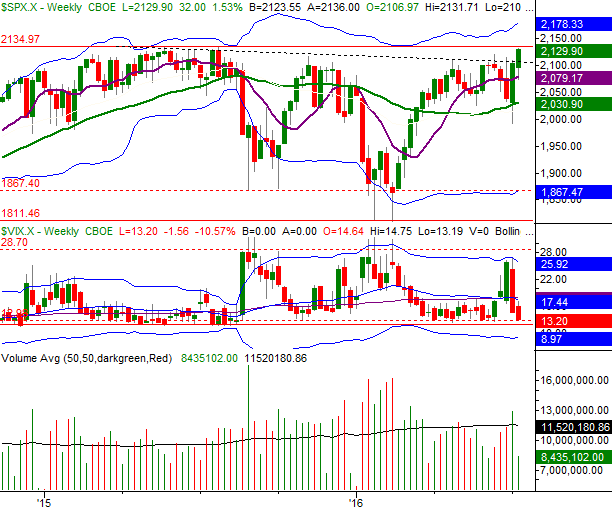
Chart created with TradeStation
Zooming into a daily chart of the S&P 500 we can glean more details about this bounce that's turned into a breakout. The minor ceiling at 2113 has been hurdled, as has the minor falling resistance line (both dashed). We've also got a bullish MACD indicator and a confirmed Percent R buy signal. That is, the Percent R line moved further above the 80 threshold (after a slight dip) on the same day the market made a higher high. That's a sign of a very strong bullish undertow.
S&P 500 & VIX Daily Chart
Chart created with TradeStation
So, the technical mechanics of the market right now are undeniably bullish. The flaw in the bullish argument, however, lies in the fact that the NASDAQ (QQQ) is lagging rather than leading the technical progress. It should be out in front.
Take a look. Last week's decent move -- thanks to Friday's big 1.6% pop -- was halted once a long-established resistance line (dark, dashed) was encountered. You can see this line extends all the way back to November of 2015. What you can't see on the chart is that this line actually extends all the way back to the July-2015 peak of 5231.94 for the composite. Just above Friday's close of 4956.76 is a horizontal resistance line AND an upper Bollinger band at 4982. Above that mark, the NASDAQ is home free. Until (and unless) the index clears that hurdle though, the NASDAQ Composite hasn't actually done anything terribly impressive.
NASDAQ Composite & VXN Daily Chart
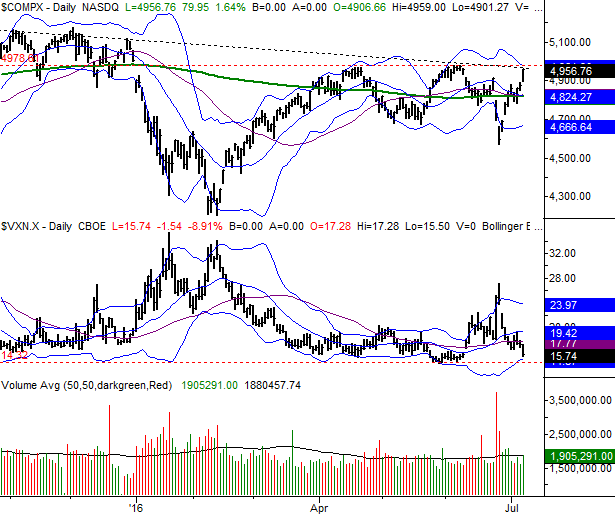
Chart created with TradeStation
Zooming out to a weekly chart of the NASDAQ Composite puts the daily chart in perspective. A push above 4980 could be quite catalytic. There's a big wall dead ahead though, and the Nasdaq Volatility Index (VXN) is back near uncomfortably low levels.
NASDAQ Composite & VXN Weekly Chart
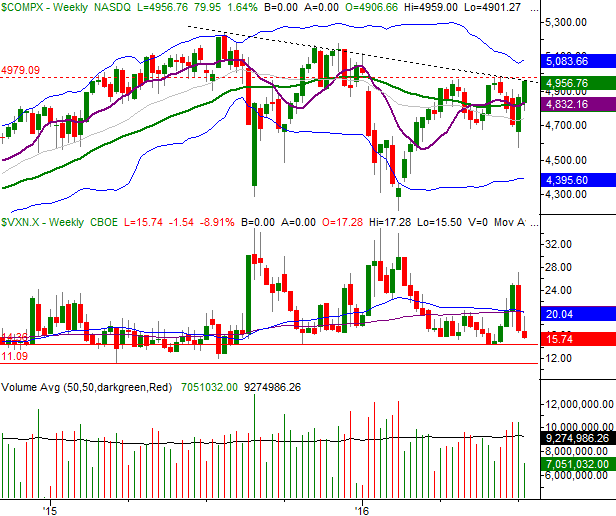
Chart created with TradeStation
Bottom line? It's do or die time for the bulls. Do know that a rally from here, as possible as it may be, will materialize at a point when stocks are already overvalued on an earnings basis. But, it's happened before, and can happen again. Just remain prepared for a corrective move whether or not the indices break through resistance levels. Stocks are still overbought, up 17.7% just since February's low.
Potential upside targets/resistance levels: For the S&P 500, 2180. For the NASDAQ, 5100 ish.
Potential downside targets/support levels: For the S&P 500, 2030. For the NASDAQ, 4680.
Trade Well,
Price Headley
BigTrends.com
1-800-244-8736