Weekly Market Outlook - Tug Of War Continues
BigTrends.com Market Outlook - August 22, 2016
For the second week in a row, stocks were content to simply drift sideways.... the result of opposing factors simultaneously weighing on investors' mind. From one direction stocks are being buoyed by low interest rates that could linger for a while, while from the other direction the market's high valuations may be keeping a lid on things. The bulls are technically winning the war, but it's a marginal victory and the tide could turn quite easily.
We'll weigh the odds in a moment. Let's first take a closer look at last week's and this week's economic announcements, which will set the tone for whatever the market's got in store.
Economic Data
We got a fair amount of economic news last week, but only three items were of real interest.
The first of those three was Tuesday's consumer inflation update, rounding out the prior week's producer price inflation report. Like the PPI figure, the CPI figure was even more tepid than expected, rolling in flat versus forecasts for 0.2% growth. Core CPI was only up 0.1%, versus expectations for 0.2% growth. The annualized versions of the data below indicate a stable if not slumping inflationary environment, meaning the Fed still has time and room to wait on a rate hike.
Inflation Chart
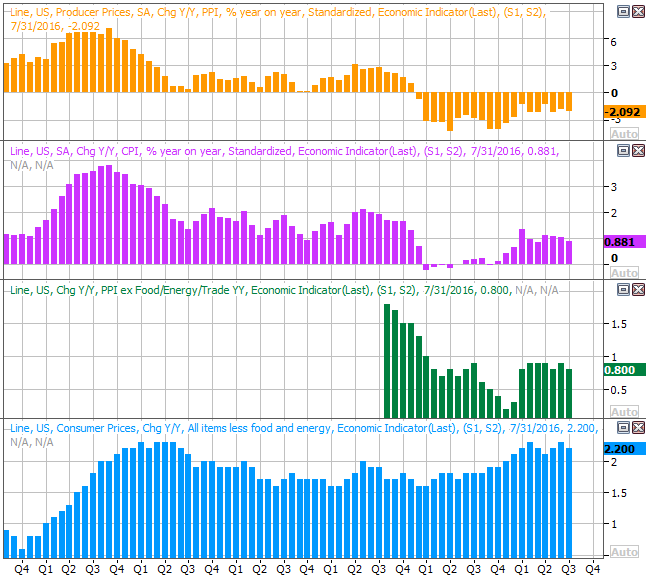
Source: Thomson Reuters
Housing starts were up just a bit, and building permits slowed. Both remain on broad uptrends though.
Housing Starts and Building Permits Chart
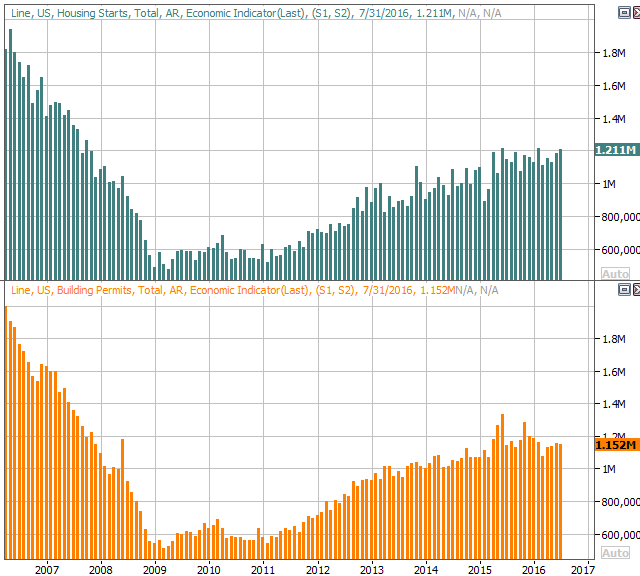
Source: Thomson Reuters
Finally, last week's biggest news was the report on July's capacity utilization and industrial productivity. Both were up, and by more than expected. This is a much-needed reversal of the capacity utilization downtrend, and a nice rekindling of what had become stagnant productivity. The correlation between these two data sets and the stock market (and market earnings) is strong, even if only for the long haul.
Industrial Productivity, Capacity Utilization Chart
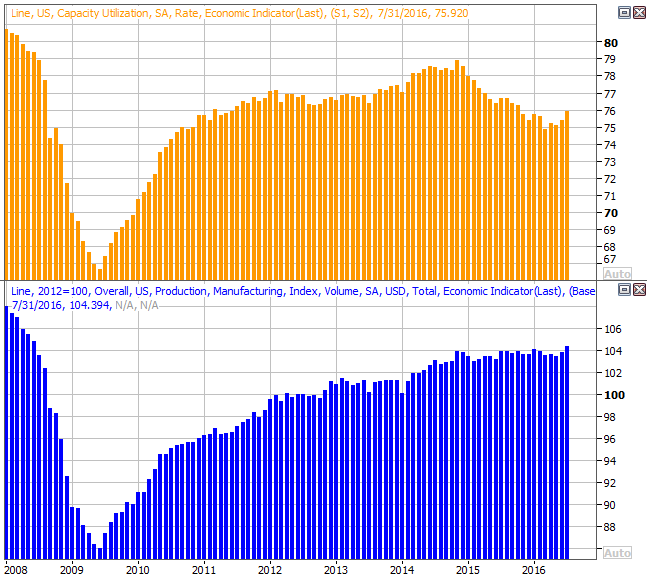
Source: Thomson Reuters
Everything else is on the following grid:
Economic Calendar
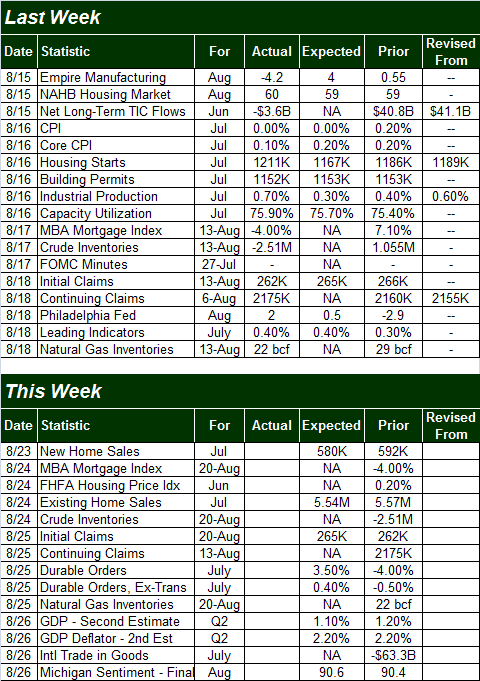
Source: Briefing.com
This week isn't going to be as busy as last week, though it's a huge week for home sales and home prices. On Tuesday we'll get last month's new home sales figures, and on Wednesday we'll hear about July's existing home sales pace. Both are expected to cool a little from June's levels, but each remains in a broad uptrend.
New and Existing Home Sales Chart
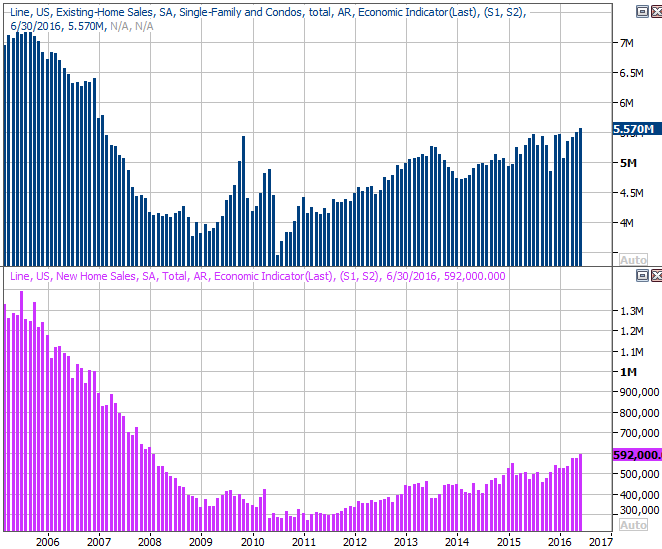
Source: Thomson Reuters
We're also going to hear July's durable orders numbers on Thursday. Look for a 3.5% increase following June's 4.0% dip, but don't get too excited just yet. That swing factors in transportation orders (planes, trains, and automobiles). Taking them out of the equation, July's durable orders growth is only expected to rise 0.4% versus June's 0.5% dip. Either way, we've seen a slow deterioration of orders since 2014, with and without transportation orders in the mix.
Durable Orders Chart
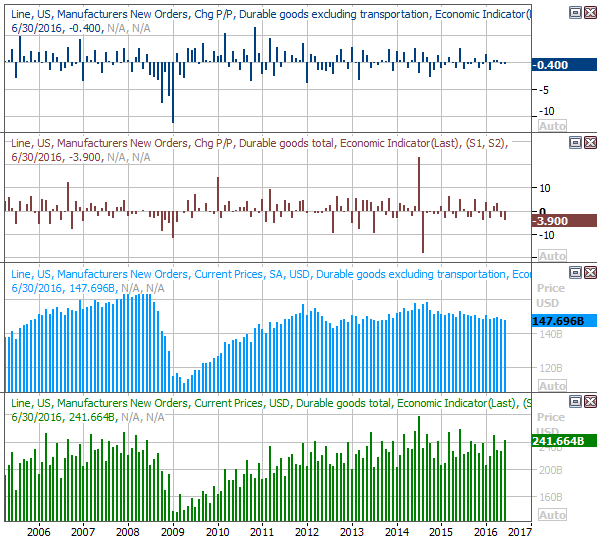
Source: Thomson Reuters
Stock Market Index Analysis
Calling a spade a spade, investors are in a conundrum right now. The bigger broad market undertow is still technically bullish, but there's nothing particularly healthy about the advance. Indeed, in many regards some clues are downright bearish.
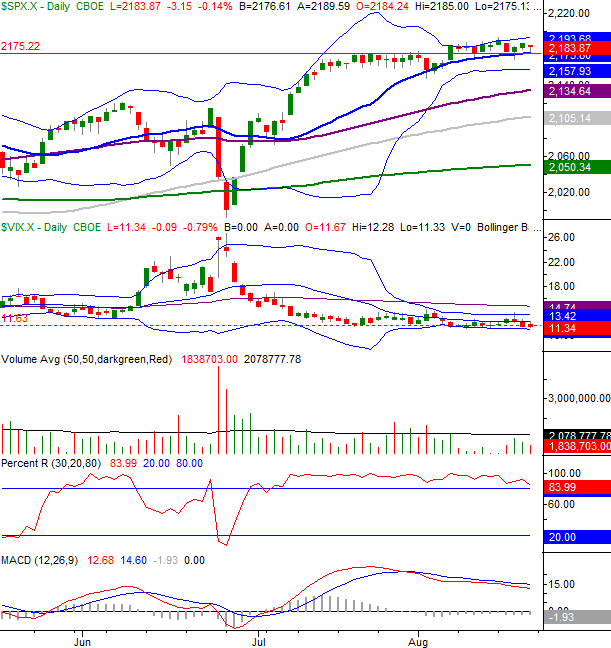
Case in point: The S&P 500's MACD lines (moving average convergence-divergence) as well as the NASDAQ Composite's are both now showing us a bearish divergence. Even without the MACD clues, though, a simple glance at either chart makes it clear the rally is slowing.
That said, until the S&P 500 (SPX) (SPY) breaks below the 2175 mark, the undertow doesn't matter. That's where the 20-day moving average line is, and that's where a former ceiling was; it's turned into a floor in the meantime.
S&P 500 & VIX Daily Chart|
Chart created with TradeStation
Be that as it may, even if the 2175 mark buckles, that's not necessarily the beginning of a monster-sized pullback. The index is now 6.5% above the 200-day moving average line, which is near the limit of how far away it can move beyond the mean before it gets reeled in again. It could slide all the way back to 2050 and still not snap the bigger uptrend (and that assumes none of the moving average lines in between here and there will act as support).
We also don't need to worry until the Percent R line gets -- and stays -- below the 20 level on the daily chart.
The daily chart of the NASDAQ Composite (COMP) tells a similar story.
NASDAQ Composite & VXN Daily Chart
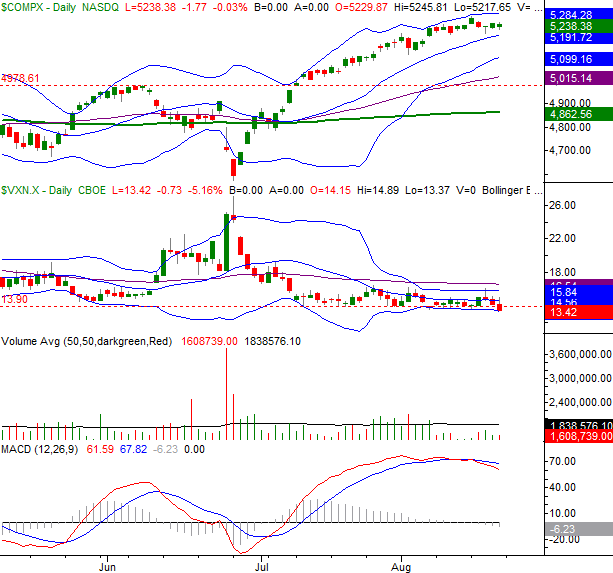
Chart created with TradeStation
Zooming out to the weekly chart of the S&P 500 we can get a better feel for the slow-down. It's also on this chart we can see there's not a lot of volume behind the move. In fact, the volume is shrinking. Part of that could be the time of year, but part of it has to be the fact that investors are hesitant to keep buying in here at a frothy valuation.
S&P 500 & VIX Weekly Chart
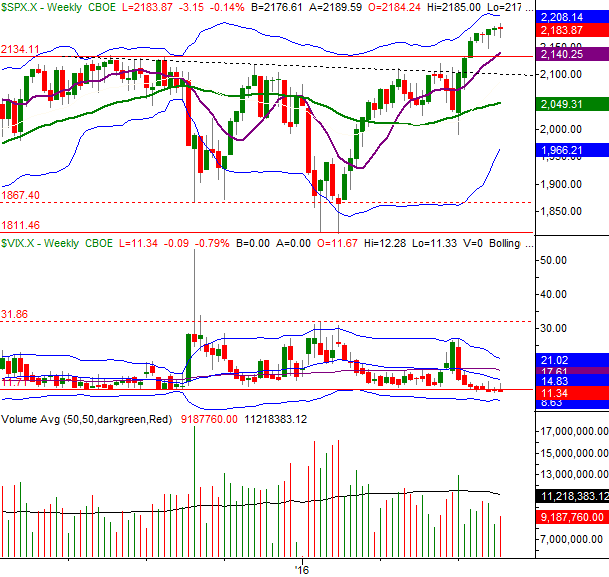
Chart created with TradeStation
The weekly chart of the NASDAQ is even more telling, in that the prior peak of 5231 -- hit in July of last year -- seems to have become a trouble spot for the recent advance. Last week's doji bar (an open and close right at the middle of a tall high/low range) often indicates an equilibrium... the point of transition between a net-buying environment and a net-selling one. This week will either complete or question that partial clue.
NASDAQ Composite & VXN Weekly Chart
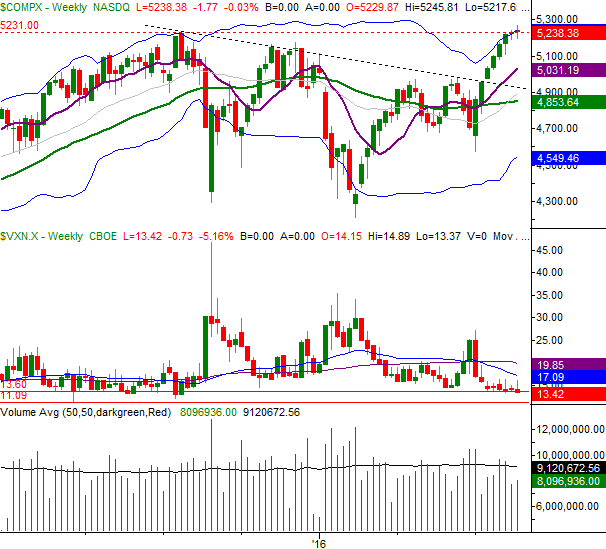
Chart created with TradeStation
The point is, stocks are very much on the fence here, and could still easily fall on either side of it. Perhaps more than anything else, the VIX and VXN are the charts to watch here. Both are near multi-year lows, but both have some room to edge a little lower, meaning there is room for stocks to push at least a bit higher. As was noted though, this week's action will provide a critical clue as to what the market is going to do at this technical pivot point.
Just be wary of a super-strong surge and a similarly sharp plunge from the CBOE Volatility Index (VIX) (VXX) or Nasdaq Volatility Index (VXN). That could mark a blowoff top. Any further upside would most likely be sustainable only at a slow, measured pace. Conversely, it would take a close at least below 2175 for the S&P 500 -- and really, a close below 2147 -- to say with any confidence the market has started any sort of meaningful correction.
Trade Well,
Price Headley
BigTrends.com
1-800-244-8736