Weekly Market Outlook - August 29, 2016
Unable to resist the weight of its 9% gain since its late-June low, the S&P 500 (SPX) (SPY) finally started to buckle last week. The index only lost 0.68% for the five-day span, but that was the worst weekly performance since June, and could end up serving as the profit-taking excuse some traders have been waiting for.
We'll look at the matter in more detail after a closer look at last week's and this week's economic numbers. They matter more than usual now, with the prospect of rising interest rates on the table.
Economic Data
The economic news dance card was pretty light last week (though we'll make up for it this week). In fact, the only items of real interest were last month's home sales data and a confirmation of the Q2 GDP growth data we heard last month.
As for home sales, new-home sales soared to a multi-year high pace of 654,000 units. Meanwhile, sales of existing homes fell to a pace of 5.39 million. Between the two, overall home sales continue to march forward. Note that home sales may be held back by a sheer lack of inventory. New home inventory fell to a multi-year low of 4.3 months.
New and Existing Home Sales Chart
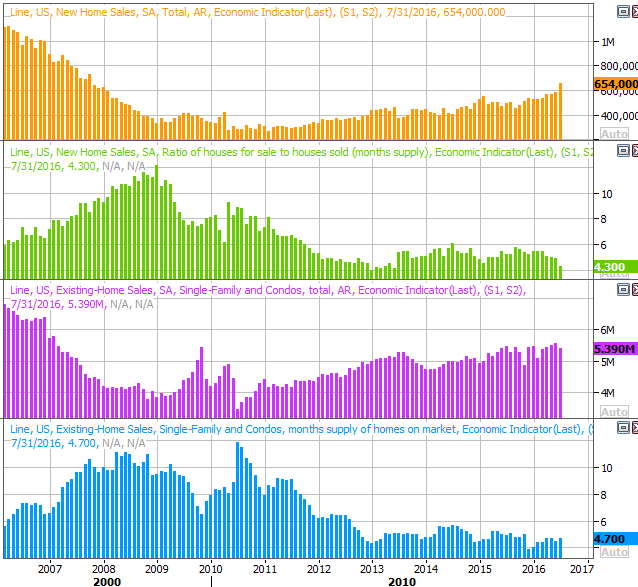
Source: Thomson Reuters
As for GDP growth, as was calculated with the first round of data, the economy grew by 1.1% last quarter. The data will go through one more revision before it's set in stone, but it's not likely to change much if it hasn't already.
GDP Growth Chart
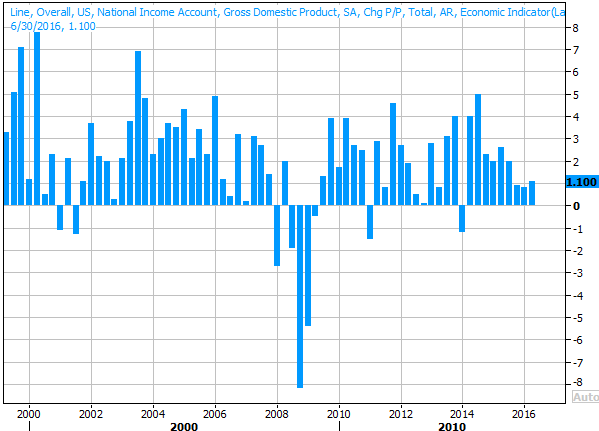
Source: Thomson Reuters
Everything else is on the following grid:
Economic Calendar
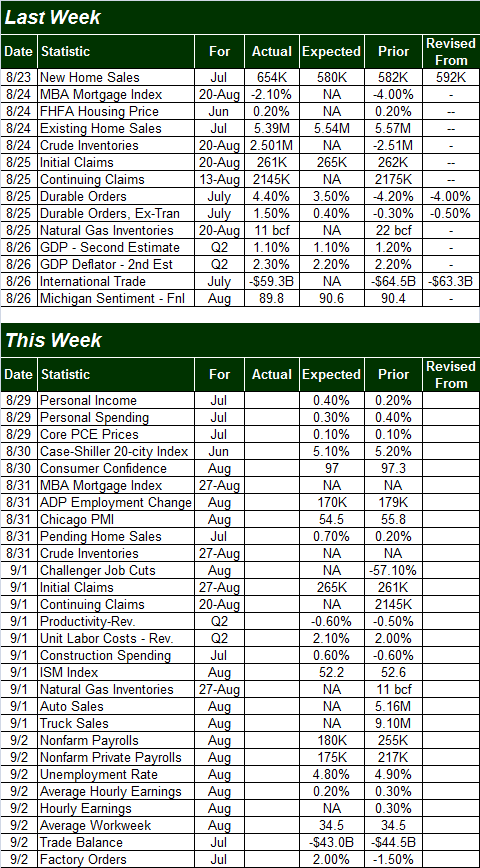
Source: Briefing.com
This week is going to be considerably busier, with the highlight being Friday's unemployment report for August. There are a couple of items well worth watching before that, however.
One of them is August's consumer confidence score from the Conference Board. We got the third and final Michigan Sentiment Index reading for August last week; it rolled in at 89.8 again. The Conference Board's measure is expected to fall from 97.3 to 97.0. We can live with the stagnation, but watch out for a sizable drop in confidence. If it falls despite the fact that stocks are still within sight of record highs, the disparity could be a red flag that traders stand poised to sell their stocks.
Consumer Sentiment Chart
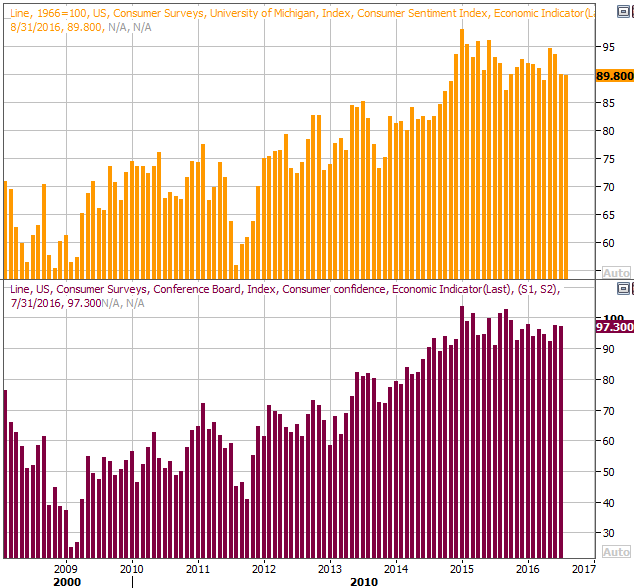
Source: Thomson Reuters
On Thursday we'll hear last month's auto sales data. The expected automobile (non-truck) sales pace of 5.06 million would be better than June's 5.0 million, but truck sales are expected to jump again. July was encouraging, but one good month isn't enough evidence to say the pullback from the peak a few months ago. A lower reading on both fronts could prove to be real trouble for the auto industry stocks.
Auto Sales Chart
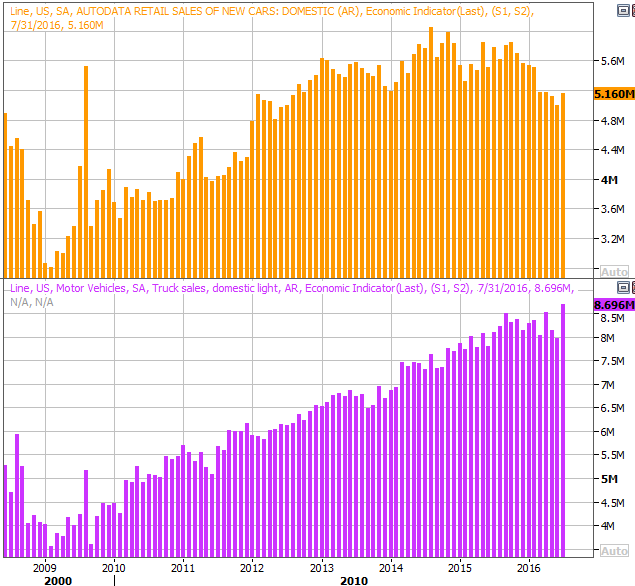
Source: Thomson Reuters
The main event, of course, will be Friday's jobs report. The pros expect the addition of 180,000 new jobs, which should be enough to pull the unemployment rate down from 4.9% to 4.8%. The prior month's surprisingly strong job growth of 255,000 new payrolls could either set up a slingshot dip in August's job creation, or could be an omen that job growth has heated up. Whatever the case, the report could be the deciding factor in the Fed's rate-hike debate.
Job Growth & Unemployment Chart
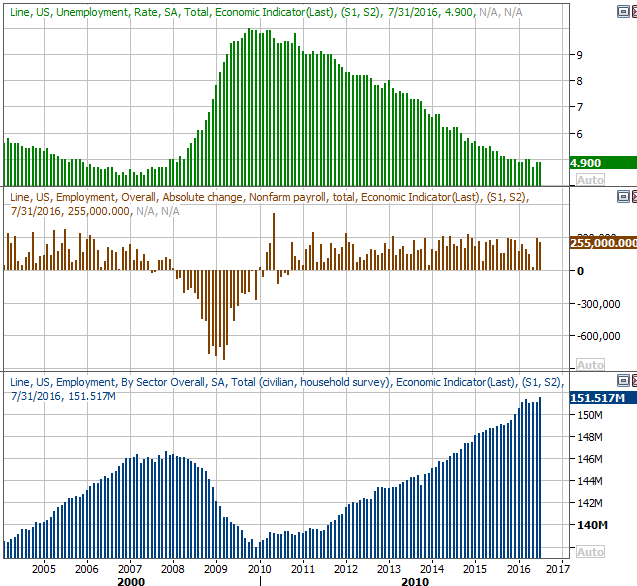
Source: Thomson Reuters
Stock Market Index Analysis
Most of what needs to be said about the market's action last week can be summed up with a quick look at a weekly chart of the S&P 500. Like throwing a ball into the air, gravity increasingly slows the ball down to a moment where it's motionless. The gravity starts to reel it back in again (and often at a faster pace than one might expect). As was noted, last week was the worst week for the S&P 500 since June, and certainly changes the complexion of the market environment.
S&P 500 & VIX Weekly Chart
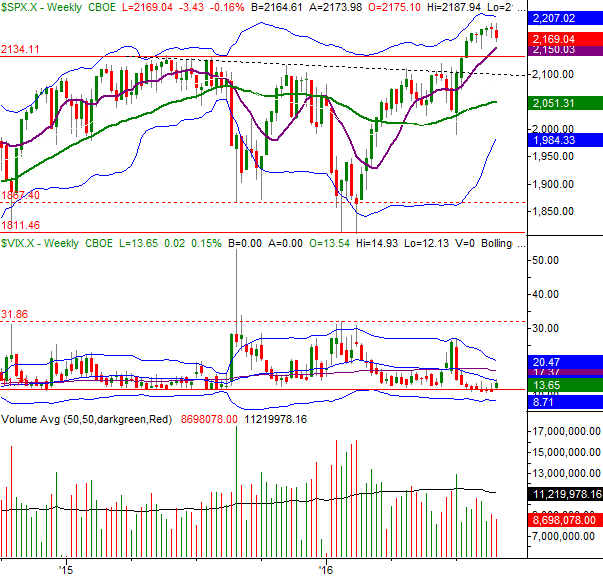
Chart created with TradeStation
The momentum of the S&P 500 wasn't the only thing that changed last week, however. For the first time in weeks the CBOE Volatility Index (VIX) (VXX) has started to reach for higher highs... the first time in weeks traders have actually said (with money, using options) they're expecting market weakness and/or volatility. It's not necessarily a lot of weakness they're looking for, but all big trends start out as small ones. The more the market falls, the more traders are apt to think it will fall even more.
Of course, with the market up 7% since June's low and higher by nearly 20% since February's low - with earnings not growing during that time - the fact that gravity may taking over now comes as no real surprise.
The weekly chart of the NASDAQ Composite (COMP) doesn't look much different than the S&P 500's does. Interestingly, all it took was a brush of (actually, a slight push above) the previous peak of 5232 in July of last year to start some profit-taking.
NASDAQ Composite & VXN Weekly Chart
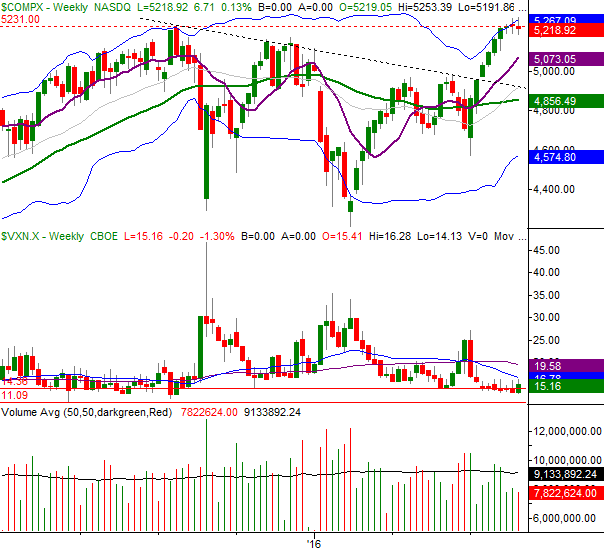
Chart created with TradeStation
One of the bright spots the bulls have going from them on both weekly charts -- or maybe it's just a lack of a sore spot -- is the fact that the volume behind the lull was on the tepid side.
Zooming into the daily charts we can glean some more details about what's underway already, and what could quell the pullback before it develops any real momentum.
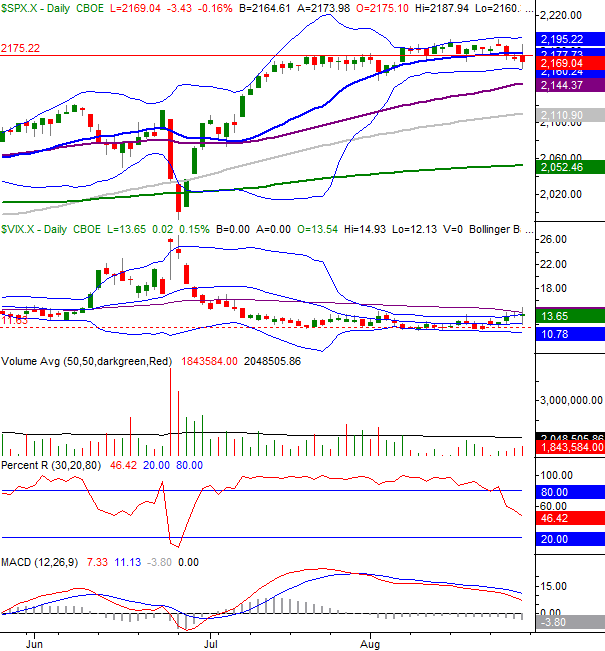
The potential reversal triggers aren't tough to spot for the S&P 500. One of them is the fact that the index only had to kiss the lower Bollinger band (20-day) on Friday for the buyers to start trickling back in again. You'll also notice the VIX, though it tried to finally push above its 50-day moving average line (purple), couldn't get over the hump.
S&P 500 & VIX Daily Chart
Chart created with TradeStation
Even so, the daily charts serve up more red flags than reason for hope overall at this juncture. The MACD lines are not only still bearish, but the bearish divergence is widening. One can also see the selling volume, though light overall last week, was progressively growing last week. Maybe there are more sellers waiting in the wings than are readily seen.
Whatever the case, the market has hardly too far gone yet. There are couple of key signals we need to see before a downtrend is confirmed. One of them is a Percent R line that gets AND STAYS below 20 after being tested. The other is the S&P 500's tumble below the 50-day moving average line (purple), currently at 2144. The VIX should be above its 50-day line as well, though as close as it is to that mark already, we would clinch that clue well before the Percent R clue and the S&P 500's break under its 50-day moving average line would materialize. Just don't jump the gun.
On the other hand, the prospect of what could happen is enough to say now's not the time to be pouring into a bunch of new long trades. Not only is the market still overbought, we're headed for a rough month from a calendar perspective.
Headed for Tough Time of Year
To say this year has been a bit unusual would be an understatement. Despite a miserable start in January, huge rallies in March and July have left the market far ahead the norm for this point in the year. While it may be an indication of a strong undertow, it could equally mean the market is ripe for a setback... and now would be the most likely time for it to happen. September is traditionally the worse month of the year, with the S&P 500 logging an average -0.68% for the month. With stocks still overextended from July's (and March's) gains, one has to respect the possibility that stocks could return to the mean/average soon.
S&P 500 Monthly Average Return Chart
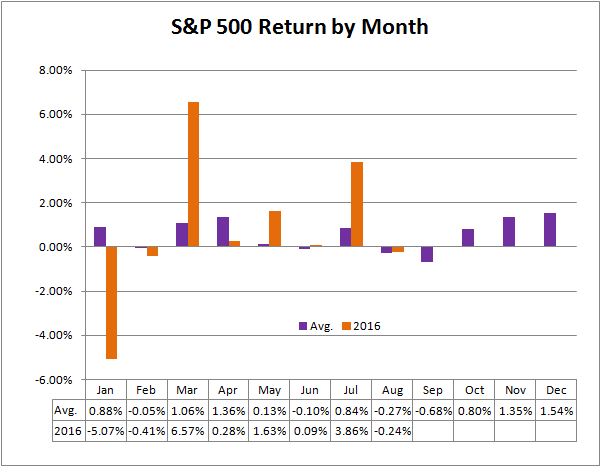
Data provided by MoneyChimp
Trade Well,
Price Headley
BigTrends.com
1-800-244-8736