Weekly Market Outlook - Reasons To Be Optimistic
Weekly Market Outlook - January 24th, 2016
After a scary start to the shortened trading week, Wednesday's intraday turnaround followed-through quite nicely all the way to the end of Friday's trading. By the time the closing bell rang that day, the S&P 500 (SPX) (SPY) had gained 1.4% after being down as much as 3.6% at one point on Wednesday.
Better still, there's room for the market to keep rising. It's still too soon to say this is the beginning of what will be a prolonged rally; there remains an entanglement of resistance lines all around SPX 2020. Nevertheless, this reversal presents an opportunity for the bulls.
We'll serve up the details of this rebound effort after a closer look at last week's and this week's economic news.
Economic Data
We got a fair amount of economic news last week, but only a couple of items were hard-hitting.
As for inflation, there's none to speak of... with or without the price of oil factored in. Overall inflation fell 0.1% in December, and on a core (ex food and energy) basis is was only up 0.1%. The annualized inflation rate for the United States is around 0.7%, including the drop in gas prices.
The only chart-worthy data from last week was December's housing starts and building permits. They were good. The uptrend continues on both fronts.
Housing Starts & Building Permits Chart
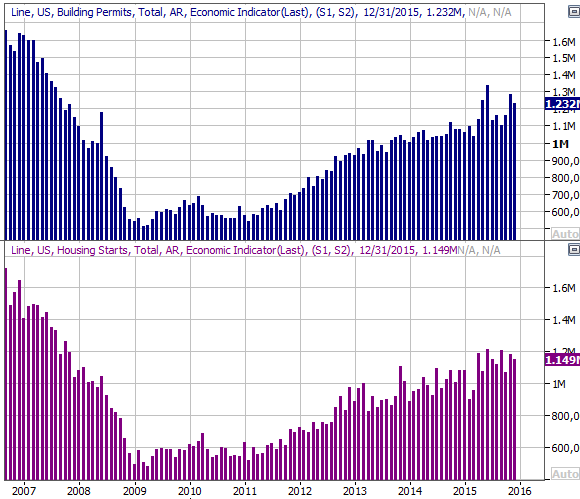
Source: Thomson Reuters
All the other data is on the following grid:
Economic Calendar
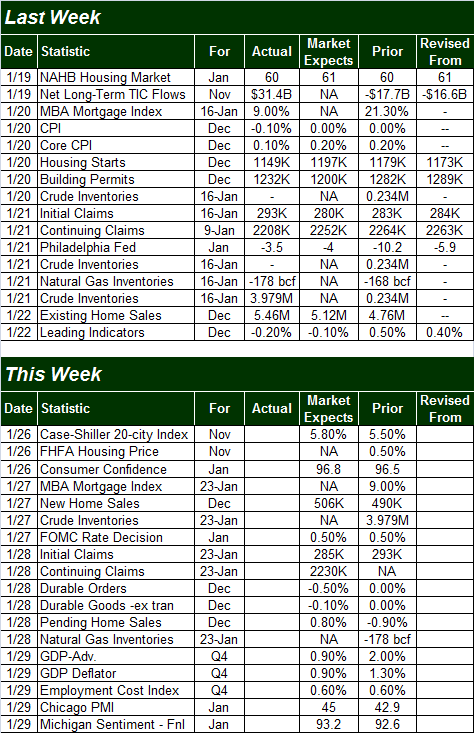
Source: Briefing.com
This week is going to be busier, with four biggies in the cards.
On Tuesday we'll get November's Case-Shiller Index (of home prices) as well as the FHFA Housing Price Index. Both have been trending higher for a while, and are apt to keep moving in that direction.
We'll also get a first look at the status of consumer sentiment on Tuesday, beginning with the Conference Board's consumer confidence score for January; economists are looking for a modest uptick. We'll also get the third and final reading of the Michigan Sentiment Index on Friday. The pros are looking for a small uptick there too. Consumers' moods are, or at least were, in an uptrend. The recent market action may have shaken them up a bit. One bad month doesn't make a trend though.
Consumer Sentiment Chart
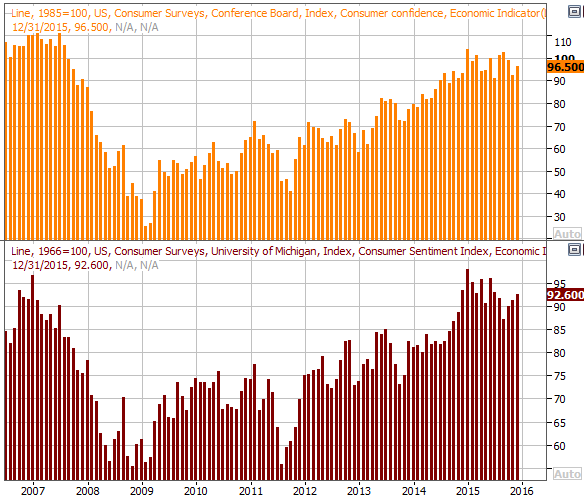
Source: Thomson Reuters
Look for durable orders on Thursday. As anemic as they were in November, forecasters are calling for an outright contraction of December's orders... with or without transportation orders.
Finally, look for the latest batch of real estate data to be rounded out with Wednesday's new home sales. Last week's existing home sales report renewed a larger growth trend, and odds are good we'll see some similar results when we hear December's new home sales pace. One can't help but wonder if a lack of inventory is actually holding home sales back.
Home Sales Chart
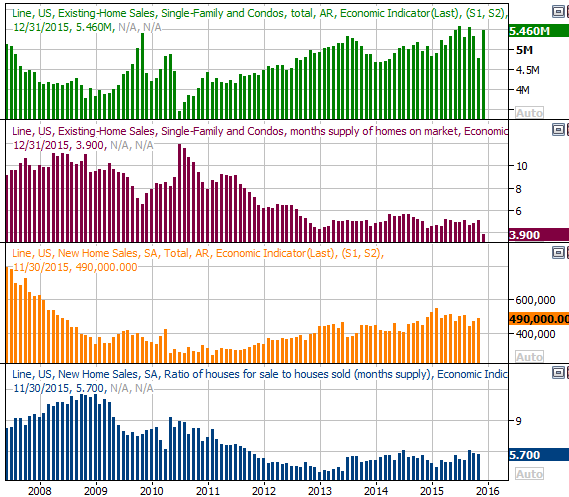
Source: Thomson Reuters
Stock Market Index Analysis
After a 12.8% pullback from high to low in just three weeks, the would-be buyers finally decided enough was enough and finally started stepping back into stocks... in spades. Just don't jump to any major long-term conclusions yet, as there are still several ways this rally could come to an early end.
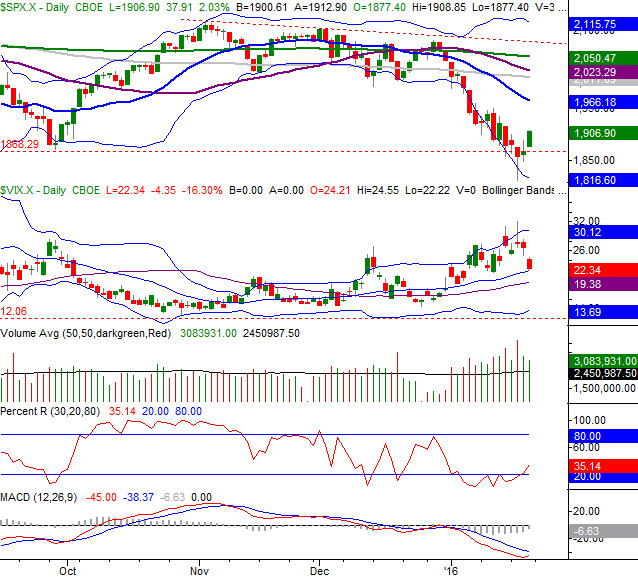
It's all been a very textbook reversal so far, started with a hammer-shaped bar on Wednesday (with the open and close at the extreme upper end of a tall bar) at the same time the CBOE Volatility Index (VIX) (VXX) formed a mirror image of the same kind of bar following prolonged - and extreme - moves from both. As the chart of the S&P 500 below also shows, the index toyed with traders by breaking under the previous low of 1868, suggesting a big breakdown was underway. Just when the market was assuming the worst, the trend reversed.
S&P 500 & VIX Daily Chart
Chart created with TradeStation
A weekly chart of the S&P 500 offers a little more perspective on these ideas. Most notably, the floor at 1868 was a really big deal, and ironically, all it took to provide inspiration for the bulls was a strong move underneath it... a move that could have just as easily been interpreted in a bearish light. We also see in the weekly timeframe how the VIX was already struggling with an established ceiling at 31.4.
S&P 500 & VIX Weekly Chart
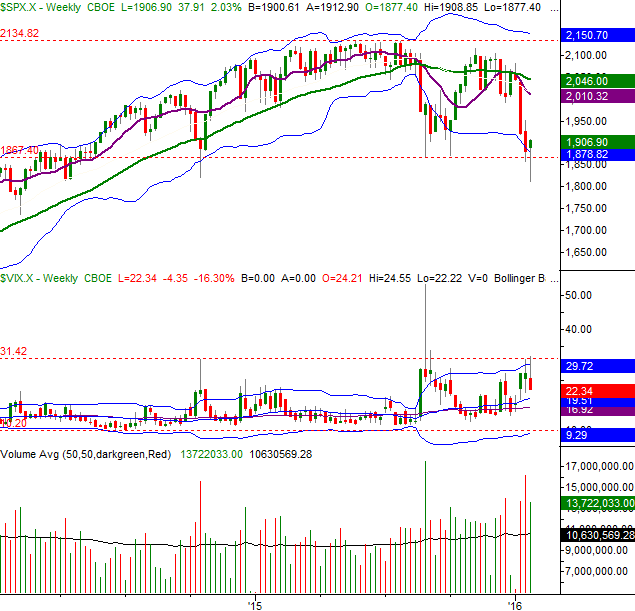
Chart created with TradeStation
With all of that being said, it's the NASDAQ Composite (COMP) that makes the most sense of the recent market action.
On the weekly chart of the NASDAQ below, a support line (black, dashed) that extends back to the last major low of 2014 only needed to be brushed before the tide turned. Within the entire trading framework the composite has established over the past couple of years, a move back to the convergence of several key lines all round 4930 looks likely. You'll also see the Nasdaq Volatility Index (VXN) has plenty of room to move lower, giving the market room and reason to keep moving higher... at least for a bit.
NASDAQ Composite & VXN Weekly Chart
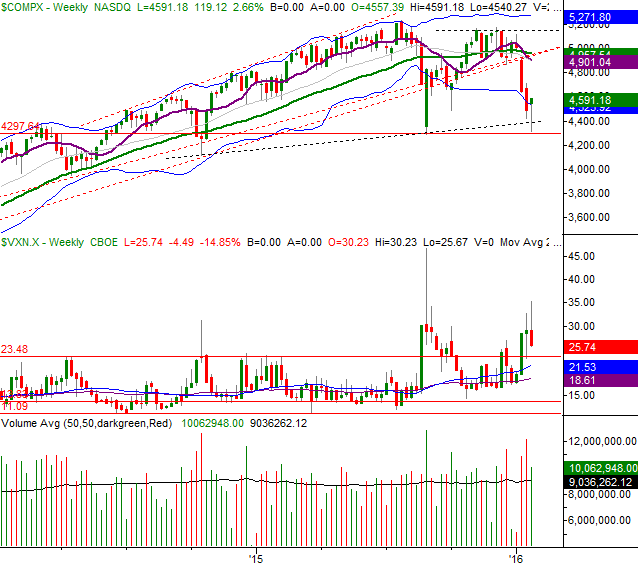
Chart created with TradeStation
The daily chart of the NASDAQ offers more detail about the pullback and brewing bounce. It's the 200-day moving average line (green) that's the most likely ceiling at this point. It may only end up being a checkpoint en route to a higher level, but it's clear from the recent past the 200-day line is not a level to assume the bulls can easily hurdle.
NASDAQ Composite & VXN Daily Chart
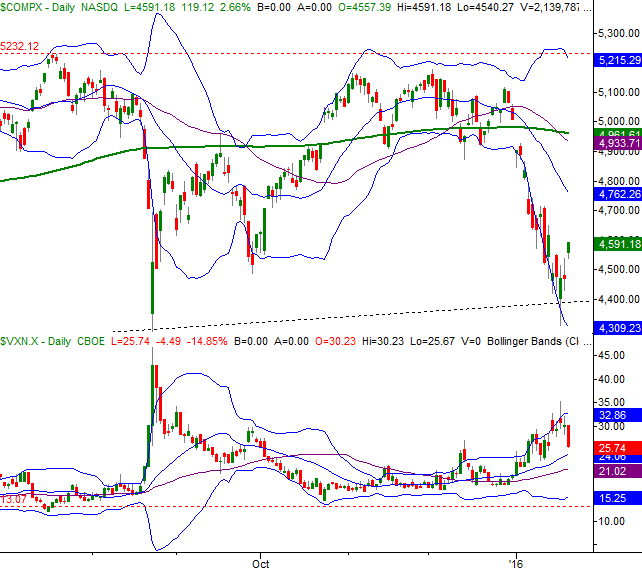
Chart created with TradeStation
With all of that being said, while the tide appears to have turned bullish again, extreme caution is still advised. While the bounce from August eventually ended up being a good one, it was also a hot and cold one, with strong dips unfurling a couple of different times before the 200-day average line was finally cleared. Given how traders are still more stunned than bullish, we can't be entirely surprised if stocks are up-ended again -- and soon -- even if only temporarily.
Gold Rebound Not a Long-Term Rally Yet
A few weeks ago, Gold prices (GLD) began to recover. It's too soon to call this a major, long-term recovery effort though. As the chart below illustrates, the turnaround was only the result of an encounter with an established support level. There are still two key resistance levels that have - and could again - act as a technical ceiling.
Gold and U.S. Dollar Index Price Chart
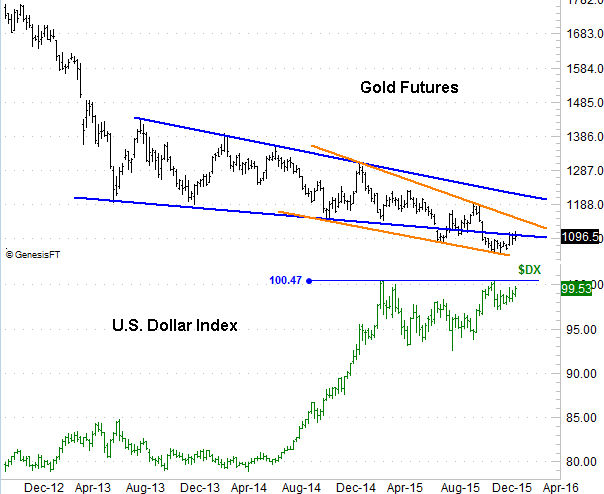
Chart created with TradeNavigator
One of the key drivers behind the broad weakness from gold has been the strength of the U.S. Dollar (UUP). And, that's one of the reasons it's too soon to trust the budding strength from gold now - the U.S. dollar index is still trying to push higher, and is even dancing with a move to a new multi-year high above 100.47.
Point being, it's too soon to take on long-term positions in gold in anticipation of a prolonged recovery.
Trade Well,
Price Headley
BigTrends.com
1-800-244-8736