Weekly Market Outlook - Mildly Bullish Undertow
BigTrends.com Weekly Market Outlook - October 3, 2016
Stocks managed to log a gain last week, but it was a "just barely" situation. The S&P 500 (SPX) (SPY) ended only 0.1% higher than it ended the prior week, and still closed below all of its key technical resistance levels. The bulls are going to have to do better than this to achieve escape velocity. Still, the undertow remains technically bullish, and a break above the ceilings here is within easy reach.
We'll look at the hurdles and weigh the odds after a quick run-down of last week's and this week's economic news.
Economic Data
Last week was relatively busy in terms of economic news, beginning with Monday's report on new-home sales (which rounded out the previous week's existing-home sales report). The pace of 609,000 units was better than expected, but still not as strong as July's pace of 659,000.
New & Existing Home Sales, Inventory Chart
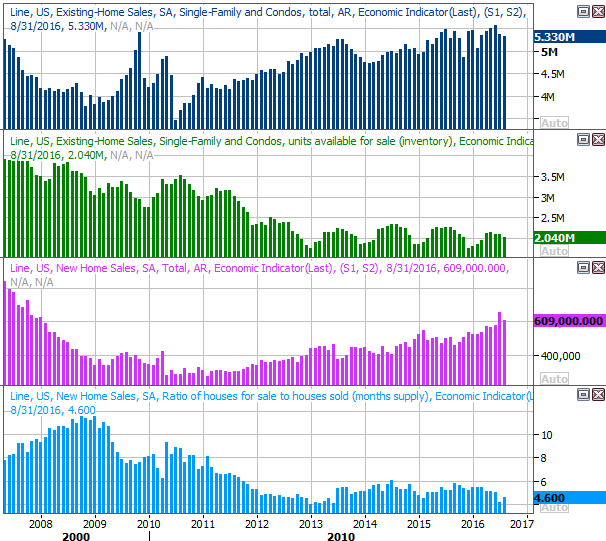
Source: Thomson Reuters
Where existing-home sales have lacked, new-home sales have generally offset weakness... and vice versa. Again, a lack of available inventory may be holding purchase activity back.
It was also a huge week for consumer-sentiment data, with the Conference Board's consumer confidence score coming out on Tuesday followed by the third (and final) September reading of the Michigan Sentiment Index being posted on Friday. The former reached a multi-year high of 104.1, while the latter moved higher, to 91.2.
Consumer Sentiment Chart
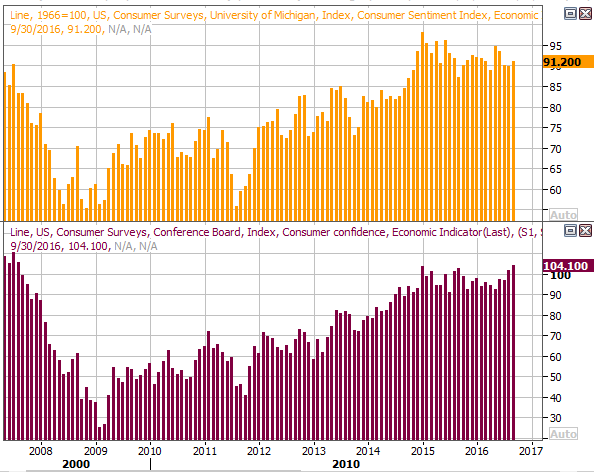
Source: Thomson Reuters
Strong sentiment is interesting here, in that economic malaise and tepid job growth -- not to mention a stagnant stock market -- would seemingly leave people discouraged. Clearly they see something encouraging though.
The only other data worth exploring from last week was the third and final reading on Q2's GDP growth rate. It was revised upward to 1.4%, which ended up being better than Q1's 1.1% growth rate, but still tepid.
GDP Growth Chart
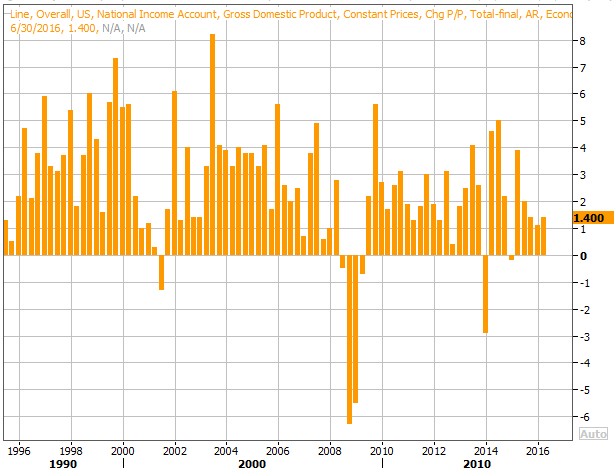
Source: Thomson Reuters
Everything else is on the following grid:
Economic Calendar
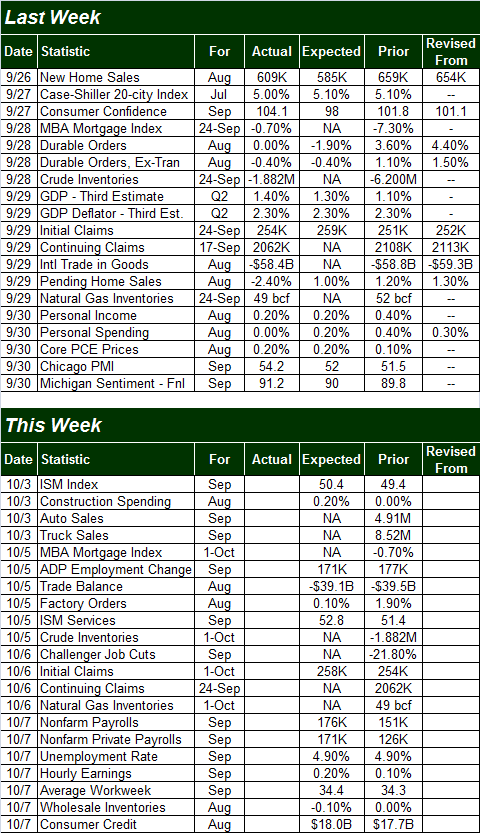
Source: Briefing.com
This week is a pretty big week in terms of economic data, with a true grand finale coming on Friday in the form of last month's unemployment report, although it's also going to be an important week for ISM data. The manufacturing ISM index will be posted on Monday, and the services version of the ISM index will come out on Wednesday. Both are expected to edge higher, but more important, both are expected to roll in above the key 50 level, which suggests growth rather than contraction. On the flip side, both continue to broadly sink, even if they're up for last month.
ISM Index Chart
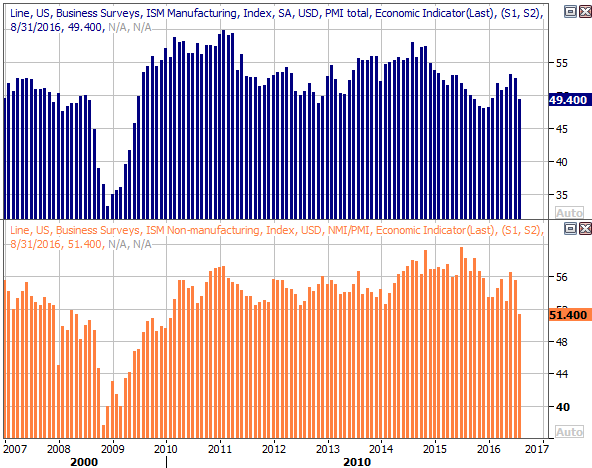
Source: Thomson Reuters
Friday's employment report for September may be even more important than usual, pushing the market off the fence of indecision. Economists are only looking for 176,000 new jobs for the month, up from August's 151,000, though it's not enough to move the unemployment dial from 4.9%.
Job Growth, Unemployment Rate Chart
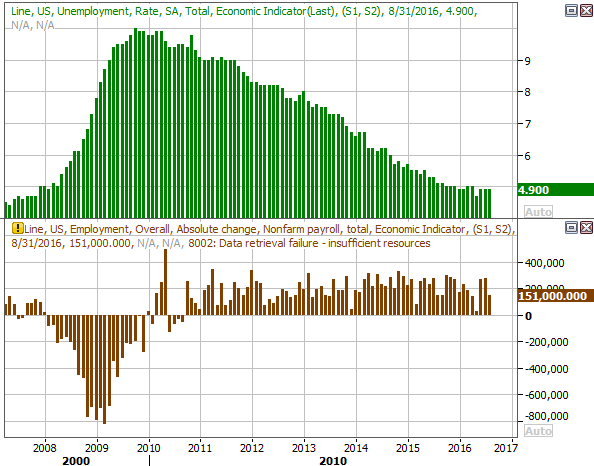
Source: Thomson Reuters
The steady pace of job growth has been impressive, but job growth has yet to be truly "strong" since the economy recovered years ago.
No chart of it, but also be prepared for September's auto sales report on Monday. Car sales have been broadly deteriorating for months now, and another poor reading could serve as a real wake-up call for optimistic shareholders of automakers.
Stock Market Index Analysis
It's not an ideal bullishness, but the undertow is indeed bullish. The indices just need to work their way a little higher not just to make their way above some major technical resistance levels, but also to push a couple of key indicators all the way into bullish territory.
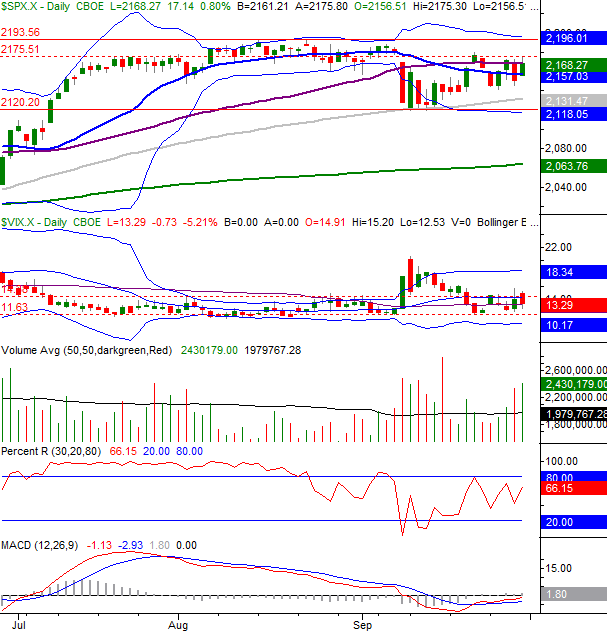
For the S&P 500, the biggest hurdle is 2175, near where the index peaked two weeks ago and where the index topped out late last week. The 50-day moving average line at 2168 has also remained an impasse. Even beyond that ceiling, though, the ceiling at 2194 is still in place, and getting stronger now that the upper Bollinger band is en route to that level.
At the other end of the spectrum, the big floor for the S&P 500 is 2120.
S&P 500 & VIX Daily Chart
Chart created with TradeStation
Though the BigTrends TrendScore for stocks is in bullish territory with a score of 70.4, that strength would mean much more if the Percent R line was back above the 80.0 level and if the MACD lines moved back above the zero level. Both indicators are headed in that direction, but neither is there yet. Both would clear those ceiling if-and-when the S&P 500 moved above 2175.
The daily chart of the NASDAQ Composite (COMP) looks a little healthier than the S&P 500's, and inasmuch as the NASDAQ tends to lead the market, that's a key bullish clue. As you can see, the composite is above many of the technical ceilings the S&P 500 is under, and is within easy reach of record highs. Its MACD lines are also not only bullish, but above the zero mark.... suggesting the undertow has been bullish for some time, even with the September stumble.
NASDAQ Composite & VXN Daily Chart
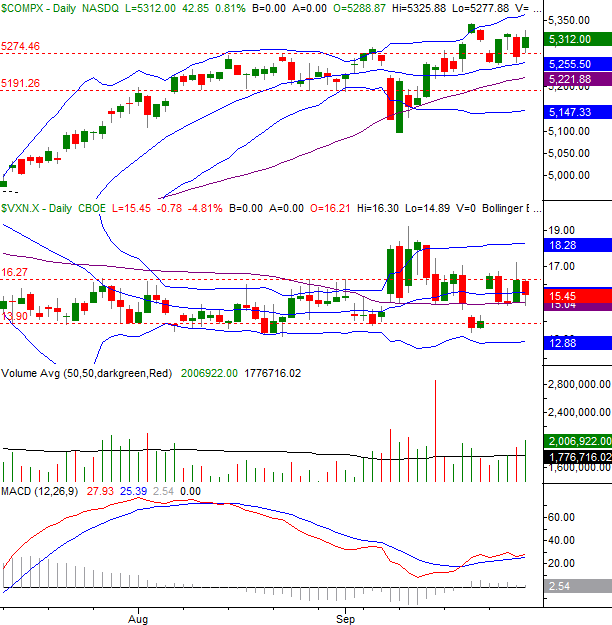
Chart created with TradeStation
Zooming out to a weekly chart of the S&P 500 we can get a sense of why it's easy to doubt the market has a lot more room to rally. It's technically overbought and visibly overextended thanks to the 20% rally from February's low. That's not to say the market can't continue to rally, but with the CBOE Volatility Index (VIX) (VXX) back to an absolute low near 11.3 and the red-hot runup creating a valuation problem, it's going to be challenging for the market to rally well.
S&P 500 & VIX Weekly Chart
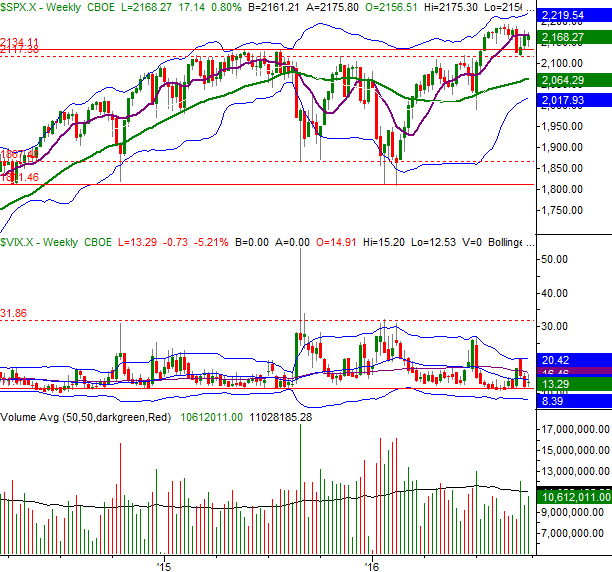
Chart created with TradeStation
While every week is pivotal to some degree, this one may be more pivotal than most. Stocks have been sitting on a fence for weeks now, ending last week where they were trading in mid-July. The indecision is mostly rooted uncertainty about the near-term future of interest rates, though that matter is being directly influenced by economic data. Even the economic news has been mixed, however. That puts all eyes on Friday's employment report, as traders grasp for some clear cut picture of what's really going on, and whether or not the economy is strong enough to actually withstand higher interest rates (or if a failure to raise rates will result in overheated inflation).
The smart-money move here may be remaining patient, and waiting for the S&P 500 to break out of its trading range. There's a lot of pent-up activity to be unleashed, and any break could last a while.... whichever direction that is.
Trade Well,
Price Headley
BigTrends.com
1-800-244-8736