Weekly Market Outlook - May 9th, 2016
The market may have finished last week on a bullish note, and started the week on a bullish note. The middle of the week, however, was rough enough on stocks to leave the S&P 500 (SPX) (SPY) down 0.4% for the five-day span.
On the other hand, when push came to shove at a critical line in the sand, the bulls were doing more pushing and shoving than the bears were. Friday's gain - small as it may have been - happened in such a way and in such a place that there's a decent chance the market may be headed into a decent May rally after all.
We'll show you how Friday's small victory may not have been so small after we run down last week's and this week's major economic headlines.
Economic Data
Last week's economic dance card was plenty full, but there's little doubt as to the highlight... Friday's employment report for April. It wasn't great. Rather than the 207,000 new jobs economists thought we'd add, we only ended up adding 160,000. That's the lowest reading in seven months, extending a downtrend. The unemployment rate stood at 5.0% even though the number of people with jobs actually slumped a bit. How so? The number of people who consider themselves in the labor force (working or not) also contracted.
Job Growth, Unemployment Rate Chart
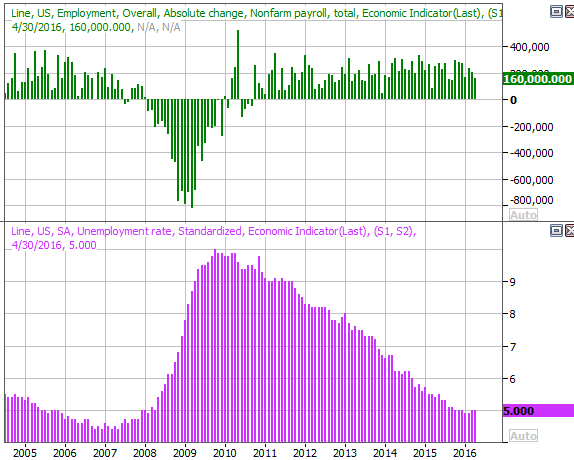
Source: Thomson Reuters
Employed, Unemployed, Not in Labor Force Charts
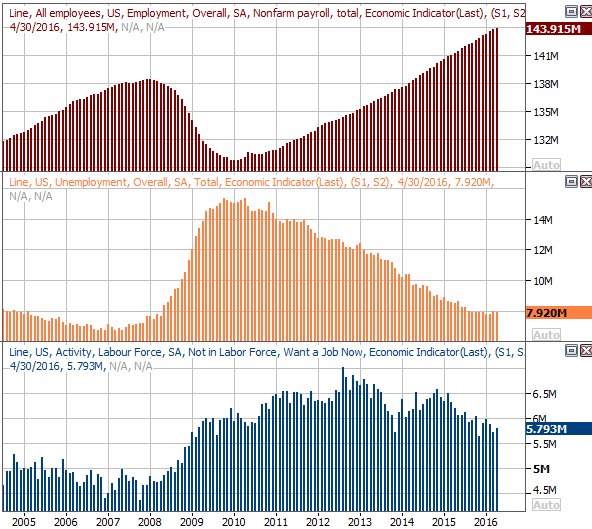
Source: Thomson Reuters
That being said, jobs weren't the only economic news worth a closer look from last week. We also heard about both ISM Indices - manufacturing and service. The ISM Index, which measures manufacturing activity, fell from 51.8 to 50.8, rolling in below expectations. Any reading above 50.0 technically indicates growth, but the index has been in a " just barely" position for a while. As for the ISM Services Index, it grew from 54.5 to 55.7, underscoring the economy's ongoing transition from a manufacturing-based one to a service-based one.
ISM Index Chart
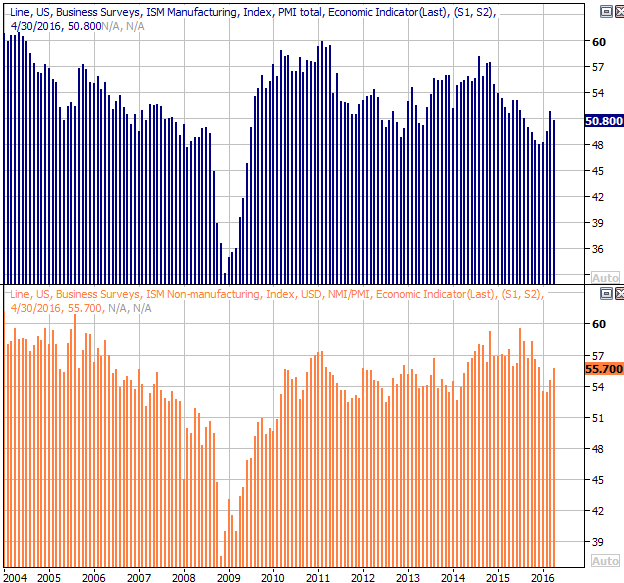
Source: Thomson Reuters
Everything else is on the following grid:
Economic Calendar
Source: Briefing.com
This week isn't going to be as busy, but there are a couple relatively important items in the queue.
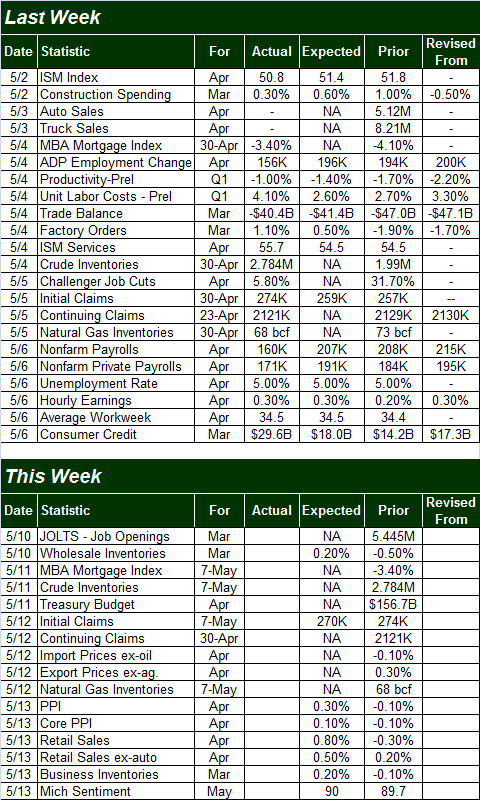
For starters, on Friday we'll hear about last month's producer inflation. The pros think we're going to swing from a contraction in March to positive progress for April. Overall producer inflation is projected to grow by 0.3%, but when stripping out food and energy costs that outlook peels back to only a 0.1% increase. All the same, on an annualized basis, overall producer inflation is down 0.1%, and removing food and energy from the equation it's still a mere 1.0%.
Producer Price Inflation Chart
Source: Thomson Reuters
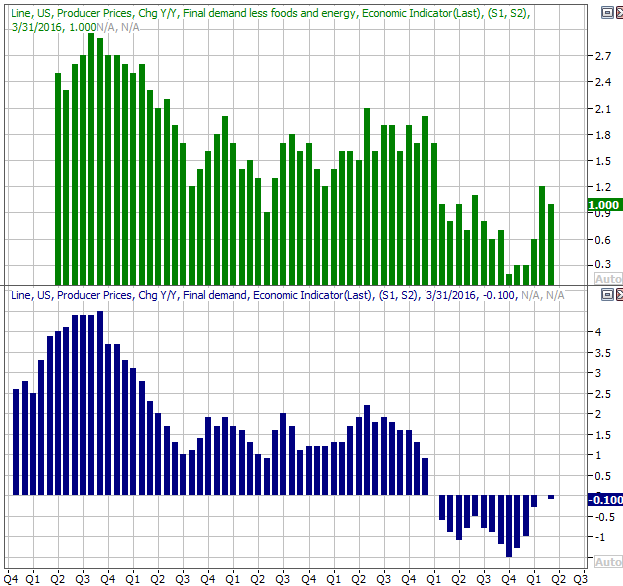
Also look for April's retail sales numbers on Friday. After a predictable March lull, we should see forward progress on this front again; economists think we're going to report 0.8% growth overall, but still report 0.5% growth without auto sales in the picture. That's a lofty goal. It's worth noting any shortcoming on the retail sales front could be interpreted bearishly for stocks.
Retail Sales Chart
Source: Thomson Reuters
Stock Market Index Analysis
In retrospect, while the past two and a half weeks may have been bearish, they shouldn't have been all that terrifying. All the market was doing was peeling back to the lower edge of a trading range. There's not been any meaningful bearish momentum develop yet.
We're close to seeing that momentum develop, mind you, so don't celebrate just yet. Just keep an open mind.
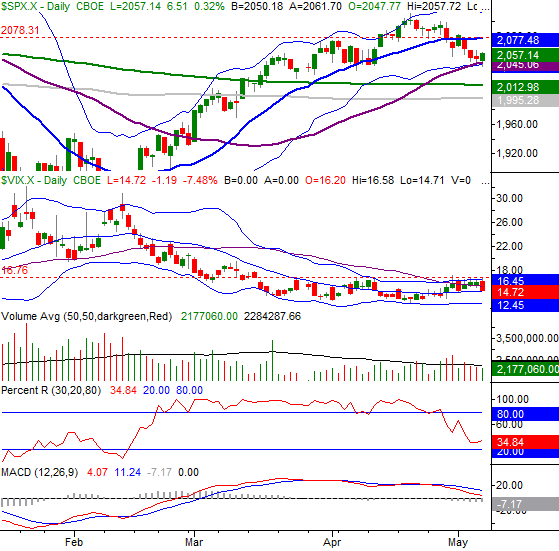
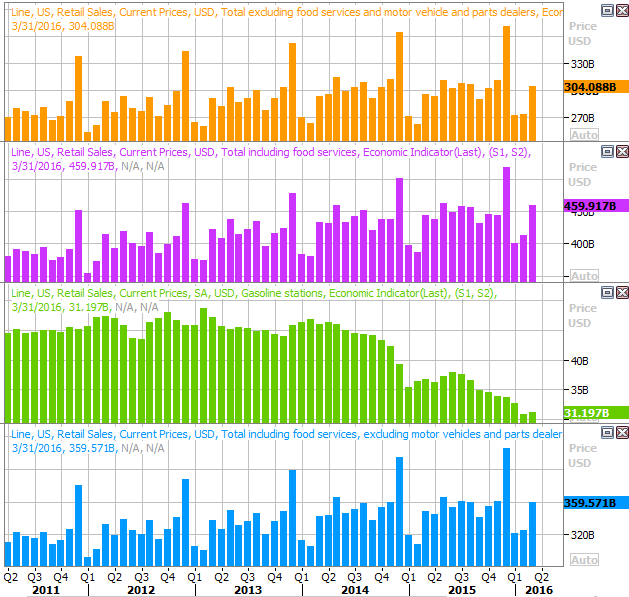
As is very clear on the daily chart of the S&P 500 below, the bleeding finally stopped last week when the index bumped into its 50-day moving average line (purple) and its lower 20-day Bollinger band... both right around 2040. These are the most meaningful potential support lines in view right now, so it comes as no real surprise the sellers are at least pausing there. The bulls could use those lines as support to entrench and then counterattack.
S&P 500 & VIX Daily Chart
Chart created with TradeStation
You'll also notice the CBOE Volatility Index (VIX) (VXX) was unable to hurdle a key technical ceiling around 17.0. If the VIX isn't ready to thrust higher, perhaps the market isn't ready to pull back. And even if the market did manage to break below its floor around 2042, the 100-day moving average line (gray) and the 200-day moving average line (green) right around 2000 could be an likely would be support, giving the bulls another chance to dig in rather than give up ground.
Whatever the case, until the S&P 500's Percent R line falls below 20 and stays below 20, we can't call any weakness a verified bear trend.
The NASDAQ Composite (COMP) is a slightly different story. That is, it has broken below its 50-day and 200-day moving average lines and is now into multi-week low territory. All the same, Friday's bar could begin a bullish push back. And like the VIX, the Nasdaq Volatility Index (VXN) retreated from a failed effort to hurdle a technical ceiling around 20.0. The VXN needs to break above 20.0 if the market is going to sink any further.
NASDAQ Composite & VXN Daily Chart
Chart created with TradeStation
Just to stave off any confusion, there's no real strong "call" here. Stocks are mostly on the fence at this point, and momentum-wise could go either direction.
Underscoring this premise is the fact that the BigTrends TrendScore ended last week in neutral territory - with a score of 59.8 - down 6.5 points from the prior reading. A reading above 60.0 is bullish, so we're close. On the other hand, the TrendScore itself just broke away from bullishness rather than towards bullishness.
The weekly chart of the S&P 500 perhaps better illustrates this idea than either of the daily charts above do. On it you can see the sheer size and scope of the February and March rally finally became too much weight to bear, not to mention the fact that the index revisited a familiar peak from November. On the other hand, what might happen and what is happening so far are two different things. It's pretty clear the 50-day moving average line needs to be snapped first before we can truly entertain the idea of a more substantial downside move.
S&P 500 & VIX Weekly Chart
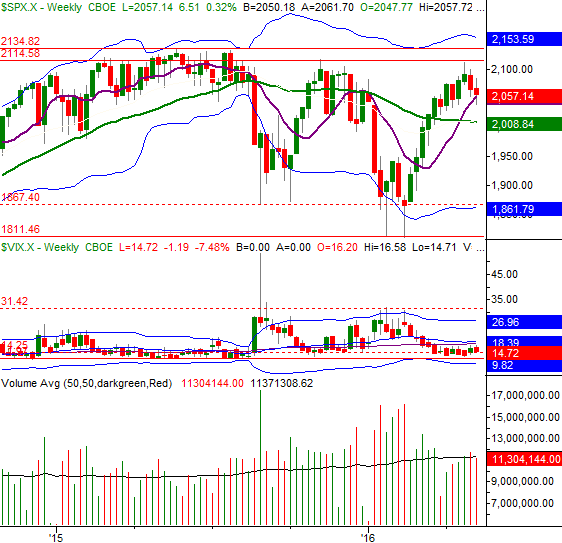
Chart created with TradeStation
The news and the media's rhetoric will ultimately contribute to which side of the fence stocks in up falling on.
Trade Well,
Price Headley
BigTrends.com
1-800-244-8736