Weekly Market Outlook - Market Looks Vulnerable
Weekly Market Outlook - June 13, 2016
The market was on pace to a decent gain last week.... until Friday. With that day's stumble, an intraweek gain of 1.0% turned into a 0.14% loss for the five-day span. Worse, the shape and location of last week's intraweek reversal hints that the tide may have finally turned bearish.
Of course, in this market, such hints don't necessarily mean a lot.
We'll dissect it all below as usual, after painting with some broad brush strokes of economic data.
Economic Data
As was noted a week ago, there simply wasn't on the economic news worth reviewing on the dance card. We'll move straight into what's in the lineup this week.
Economic Calendar
Source: Briefing.com
While last week was lame in terms of economic events, this week more than makes up for the dry spell; several of them are worth a closer look headed into the reports. In order of appearance...
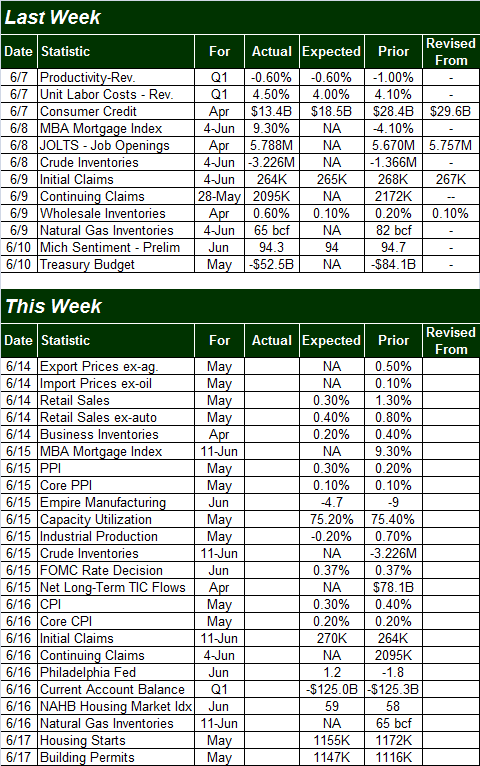
On Tuesday, look for May's retail sales report. There were no available estimates as of print-time, but recall that April's consumer spending was especially strong following March's slight but disappointing lull. All the same, April's retail sales of this year were higher than April-2014's sales on almost all fronts. Despite a bevy of Q1 earnings misses from many of the market's more prolific retail names, overall spending remains solid, even if not overheated.
Retail Sales Chart
Source: Thomson Reuters
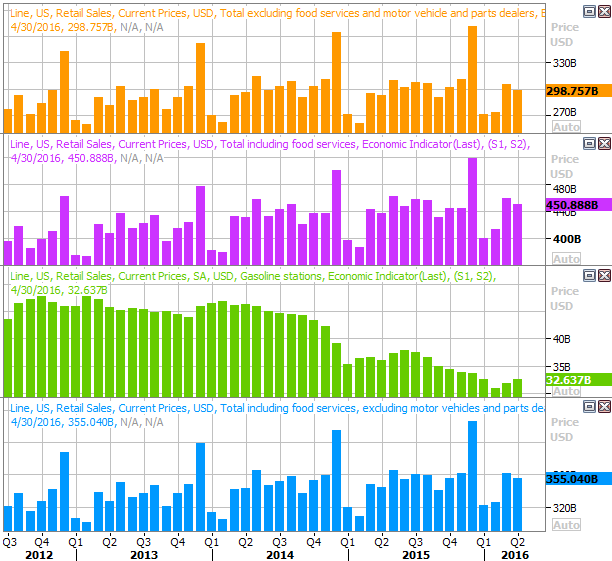
On Wednesday and Thursday we'll get last month's producer price inflation and consumer inflation rates, respectively. Both are expected to edge higher, on a core as well as a non-core basis, though not to a concerning degree. And, as of last month's data, not only are the annualized inflation rates at levels palatable to the Federal Reserve, but they're sinking. The trend adds to the reasons the Fed can postpone the next rate hike (not that there weren't enough already).
Inflation Chart
Source: Thomson Reuters
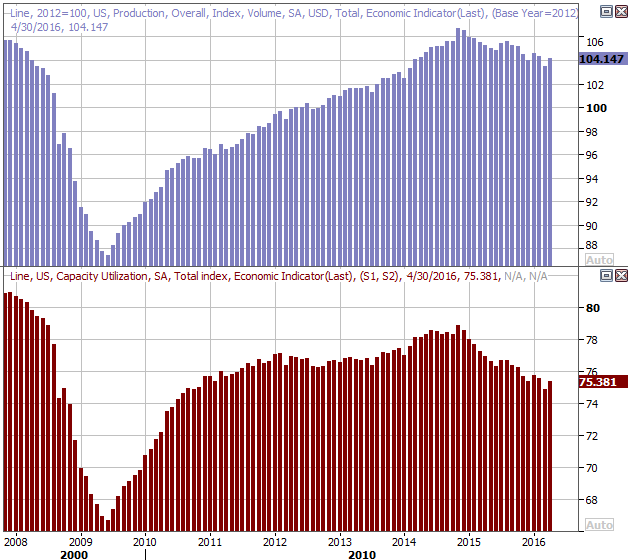
Also on Wednesday look for May's capacity utilization and industrial productivity numbers. The pros are looking for lower figures on both fronts, bringing a quick end to the glimmer of hope that developed a month earlier when each ticked a bit higher. The bigger trend remains bearish for both. The demise of oil gets the bulk of the blame, though the cause doesn't matter. Falling productivity and capacity utilization tend to coincide with major market headwinds.
Capacity Utilization and Industrial Productivity Chart
Source: Thomson Reuters
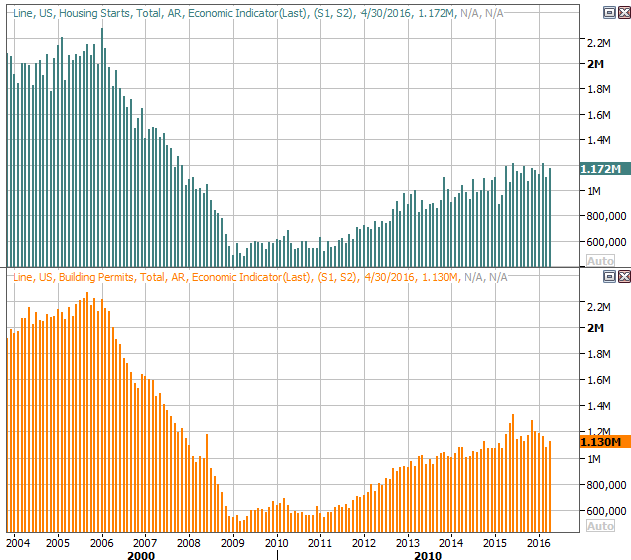
Finally, on Friday look for last month's housing starts and building permits. Economists aren't looking for much in the way of change from April's starts and permits, which is a bit of a problem - there's some stagnation here, and we're still miles away from the levels enjoyed in 2005. The market could really use a good showing here.
Housing Starts and Building Permits Chart
Source: Thomson Reuters
Stock Market Index Analysis
Just two days after the S&P 500 (SPX) (SPY) punched through a ceiling at 2110 and made traders things a breakout move was underway, the bears pulled the rug out from underneath the market. Was it all just a setup? Maybe.
Whatever the case, as has been the case for months now, stocks are back on the fence, with the bullish argument holding no more and no less water than the bearish argument.
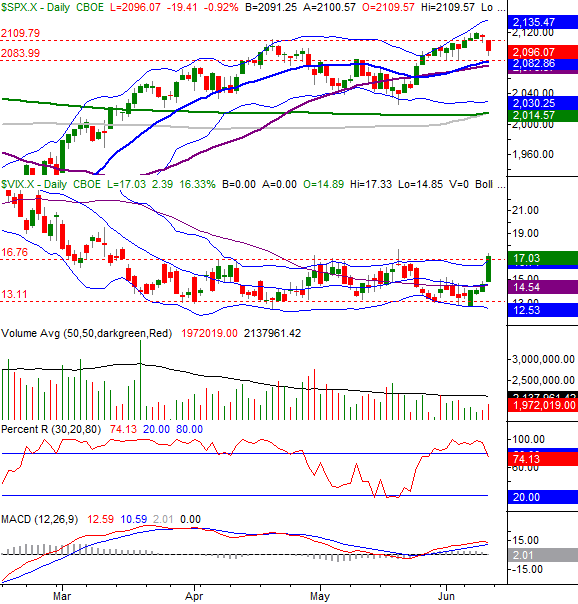
The bullish case for the S&P 500: Despite Friday's 0.92% pullback, the index remains above the 20-day (blue) and 50-day (purple) moving average lines. And, the selling volume remains quite light. It's also worth noting that while the VIX surged on Friday, that rally was capped at a well-established ceiling at 17.0... where the CBOE Volatility Index (VIX) (VXX) has peaked several time since early April. Each time the VIX failed to clear 17.0, the market managed to edge a little higher.
S&P 500 & VIX Daily Chart
Chart created with TradeStation
The bearish case for the S&P 500: The momentum as of Friday's session is bearish. Though we don't yet have a bearish MACD crossunder, we're close. We're also close to breaking below the aforementioned 20-day and 50-day moving average lines. If they fail to hold up as support, the next stop it the 2020 area... where a couple of other key moving average lines are converging.
Perhaps the biggest red flag for stocks right now, however, is the shape of last week's entire bar. The open and close were both very near the low, and both well below what ended up being the highest high we've seen since July of 2015. The shape of the bar hints that the bulls tried to get another wave of bullishness going, but ran out of gas before they got anything going. If the tank is empty, the market will reflect that soon enough (and it was this kind of action that marked the beginning of most of the recent pullbacks).
S&P 500 & VIX Weekly Chart
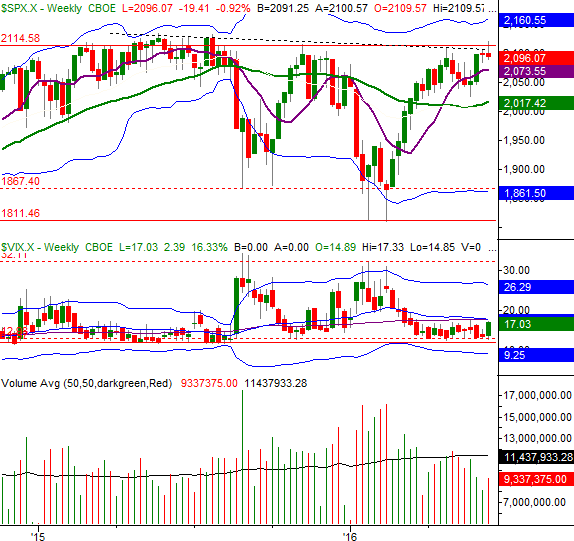
Chart created with TradeStation
Some more things need to happen for the potential bearishness to become actual bearishness. Namely, the VIX needs to get - and stay - above 17.0 and the S&P 500 needs to break under 2080 before there's any real need to worry.
On the flipside, a smartly-paced move back above 2110 at the same time the VIX peels back (without plunging) could spark another wave of bullishness. Just know there's a huge ceiling at 2135 -- where the S&P 500 hit a multi-year high in the middle of last year -- that will likely be a make-or-break level if tested. And, with the S&P 500's trailing P/E now at 20.5, the market's got more vulnerability than opportunity.
Personal Products Stocks Show Strength
Even though the near-tern pressure is to the downside, the bigger undertow - and momentum - remains bullish, and most stocks/sectors remain much closer to new highs than new lows. In fact, even though many traders are looking for reasons and ways to push stocks even higher, the fact of the matter is, most stocks are alarmingly overbought and ripe for a pullback.
Not so with the personal products group, as evidenced by the Dow Jones Personal Products Index (DJUSCM) (XLP) (XLY). Although it's near new highs, unlike most other groups, it was kept at bay between late-2013 and late-2015; there's still a lot of lost time to make up for. Indeed, what used to be a ceiling around 510 has since become a floor, bringing a quick end to pullbacks over the course of the last three months.
Dow Jones Personal Products Index Chart
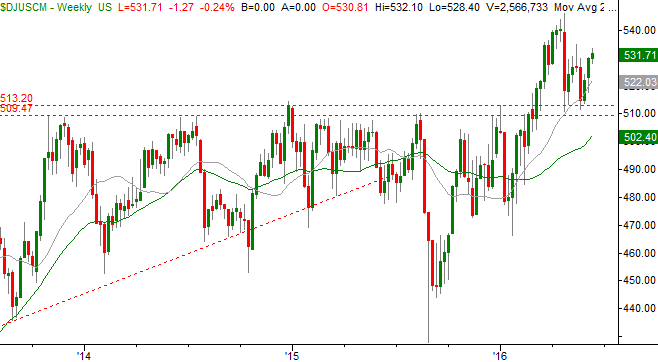
Chart created with TradeStation
It's admittedly a little off the beaten path, but this is a really good setup. It may be worth drilling into the sector to see is some individual stocks justify more of the upside being suggested here.
Trade Well,
Price Headley
BigTrends.com
1-800-244-8736