Weekly Market Outlook - Cleared Some Hurdles
Weekly Market Outlook - March 14, 2016
Though it didn't hit the ground running last week, a strong Friday session translated into a fourth straight week. of gains. Better still, the S&P 500 (SPX) (SPY) managed to just clear a major technical hurdle, and though it's ripe for some profit-taking, investors may finally be confident enough in the current rally to keep it going. The beginning of this week, however, is critical if the advance is going to last.
We'll weigh the risks and rewards after a quick preview of this week's potentially market-moving economic news.
Economic Data
As was noted a week ago, last week was a very dead week in terms of economic news. What little we had is all on the grid below.
Economic Calendar
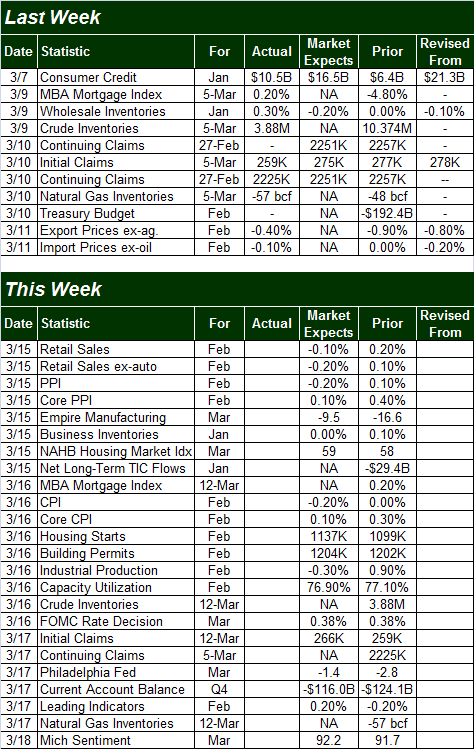
Source: Briefing.com
This week is clearly going to be busier. We can't preview all of it, but we can serve up a glimpse of the bigger items, starting with inflation.
We'll actually get two doses of inflation data... producer price inflation on Tuesday, and consumer inflation on Wednesday. After a modest but measurable increase last month, economists are looking for a lull again. Just bear and mind those same economists underestimated January's price increases. The annualized consumer inflation rate now stands at 1.37%, and has been in an uptrend.
Inflation Chart
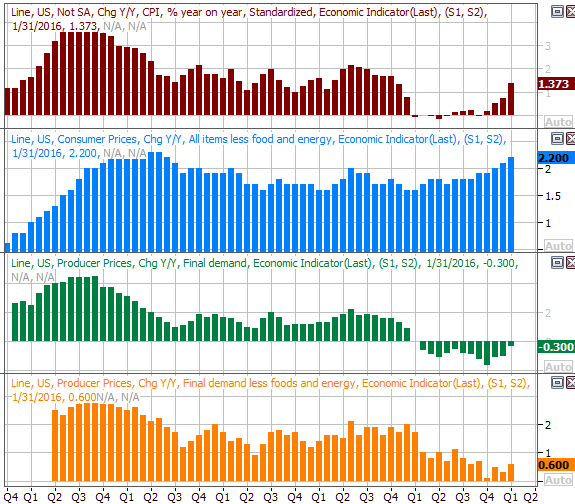
Source: Thomson Reuters
Either way, the Fed decision is slated for Wednesday afternoon, after the CPI data for February will be posted that morning. One can't help but wonder how long the FOMC will wait to make the rate hiking decision, hoping to get as much inflation data as possible before making the call. It's very much a "could go either way" scenario.
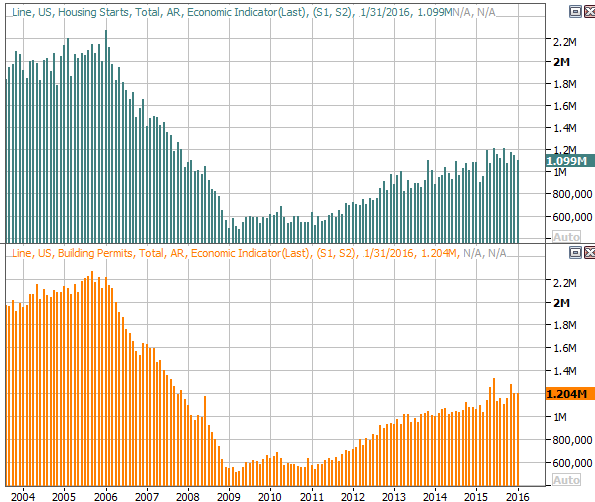
The rest of this week's big data also comes on Wednesday.... last month's housing starts and building permits, and last month's capacity utilization and industrial productivity data.
The pros are planning on capacity utilization and factory activity peeling back a little after January's promising progress. Already facing a headwind, a weak reading on one of both fronts could be damaging.
Capacity Utilization, Industrial Productivity Chart
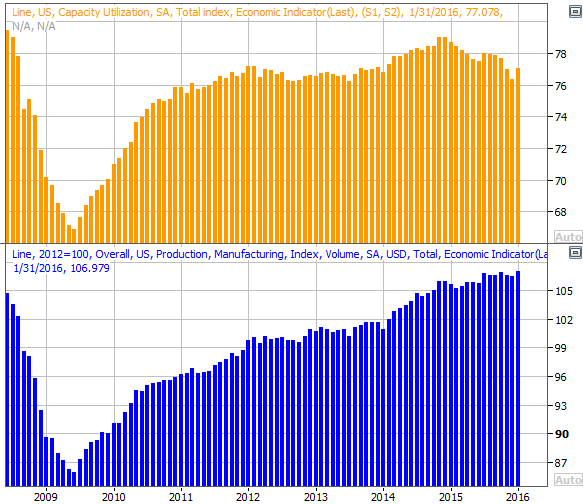
Source: Thomson Reuters
As for housing starts and building permits, both were already trending higher, and economists are expecting more modest but steady progress for February. Housing continues to be one of the economy's more reliable bright spots, even in the face of doubt. These trends are apt to continue on their current trajectories.
Housing Starts, Building Permits Chart
Source: Thomson Reuters
Stock Market Index Analysis
From a technical/momentum perspective, the trend is decidedly bullish. That's not to say more upside ahead is guaranteed; anything can and eventually will happen. But, there's not a lot for the bears to latch into, while there are several things the bulls can build one.
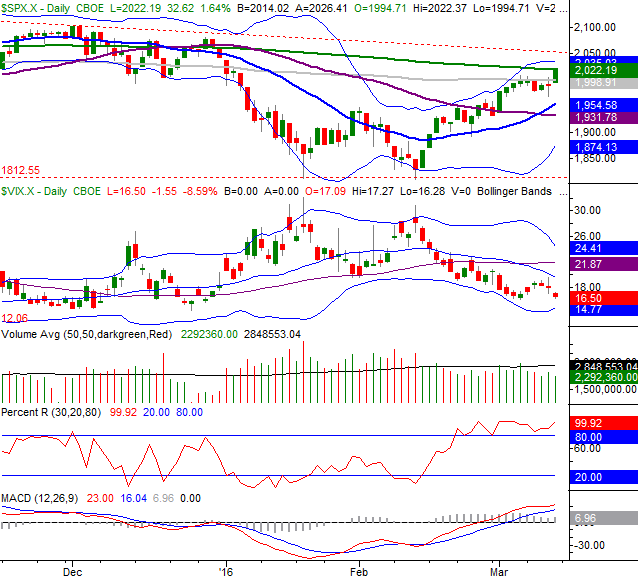
First and foremost, the S&P 500 finally hurdled the 100-day moving average line (gray) at 1999 last week, and even went on to clear - though just barely - the pivotal 200-day moving average line (green) at 2020; the S&P 500 closed at 2022.19 on Friday.
S&P 500 & VIX Daily Chart
Chart created with TradeStation
Perhaps more important, we got a confirmed Percent R buy signal at the same time we got a renewed bullish MACD signal.
The Percent R buy signal is simple... the Percent R indicator (using the BigTrends smoothed method) moves above the 80 threshold, pulls back a little without breaking under the 80 mark, and then starts to slant higher again on the same day the S&P 500 index makes a higher high. All those things happened on Friday.
It's not been a perfect rally effort. Volume has been sub-par since the bullishness began to unfurl in mid-February, and it's been shrinking the further along the bulls took the market. That could be a problem. But, if the S&P 500 can hold its ground now, that much-needed volume could start to materialize and keep this advance going. The situation makes this week very important. The index needs to find support no lower than 1932 if it's not going to immediately continue the bullish charge.
On the flipside, if the index can manage to break above what's going to be a major resistance point at 2044 (give or take), that could potential incite a melt-up... albeit a small one, in light of the market's current valuation.
Backing out to a weekly version of the S&P 500 we can see how and why this four-week rally took shape, and where it might go. All it took was a touch of the floor around 1812, and the index was ready to roll back to the upper edge of the trading range at 2134... where the index peaked early last year and where the upper 26-week Bollinger band is now.
S&P 500 & VIX Weekly Chart
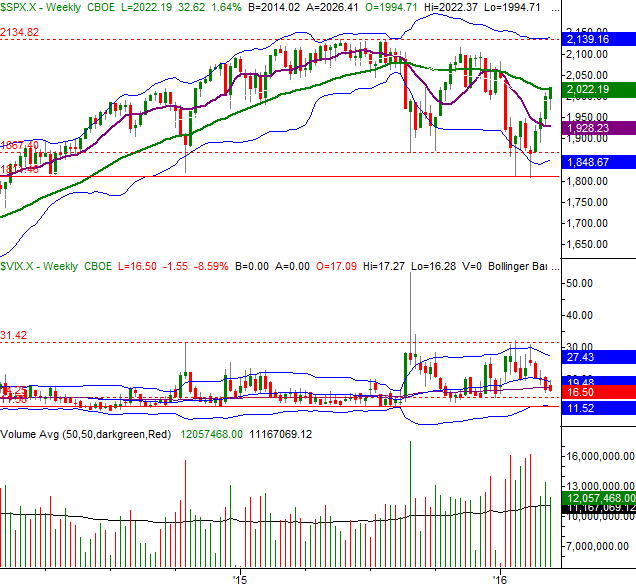
Chart created with TradeStation
Also note that the CBOE Volatility Index (VIX) (VXX) has room to keep moving lower before it tests a floor around 11.5, adding to the near-term bullish potential.
Broadly speaking, the stage is mostly set for more bullishness, though don't be shocked if after four pretty bullish weeks, the bulls take a breather. It doesn't necessarily have to mean the market is going to slip back into a full-blown downtrend; it really just might be nothing more than a well-deserved break.
In other words, don't over-react to what happens this week... especially if stocks suffer a setback. It's the response to that setback that will really matter. In fact, in many regards another bullish week could invite a more potent correction the following week to burn off the extreme near-term overbought condition.
The good news is, all the S&P 500's likely floors, ceilings, and turning points are clear and well-defined.
New Industry Uptrend
Two weeks ago we pointed out how the Dow Jones Casino Index (DJUSCA) (BJK) had just started a breakout effort from a long-term slump. In the meantime, these stocks did indeed follow-through quite nicely, with the index running up from 575.7 then to 620.4 now. That's an 8% move. Granted, the market's bullish tide helped some, but much of this strength was industry-specific, and right on cue given the technical circumstances.
Dow Jones Casino Index Chart
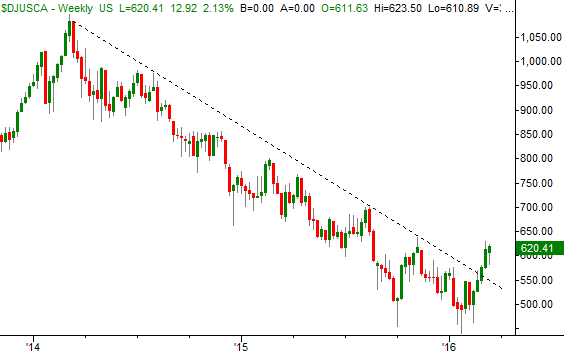
Chart created with TradeStation
In a similar vein as the call on casino stocks, software and computer services stocks are in a nice near-term uptrend within a longer-term uptrend.
The chart of the Dow Jones Software and Computer Services Index (DJUSSV) below isn't tough to interpret. Trapped in an upward-sloping diverging wedge, the group kissed the lower edge of that trading range five weeks ago and - right on cue - began a strong move back toward the upper boundary.
Dow Jones Software and Computer Services Chart
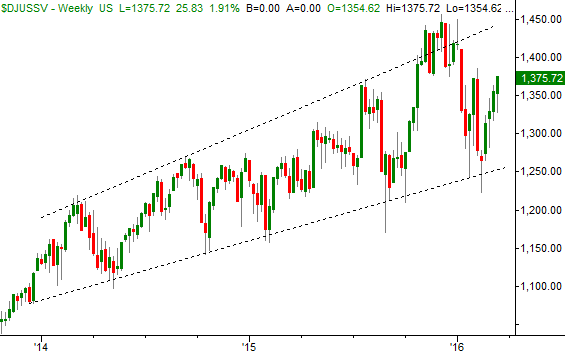
Chart created with TradeStation
This strength is only a short-term swing, whereas the casino rally has the potential to be a long-term move. It's still a high-odds move, however.
Trade Well,
Price Headley
BigTrends.com
1-800-244-8736