Weekly Market Outlook - Bullish, But Facing A Wall
Weekly Market Outlook - November 22nd, 2015
Last week a diametrical opposite to the action from two weeks ago. Two weeks ago, the bears were firmly in charge, and picking up steam. Something happened over the prior weekend though, and stocks hit the ground running higher last week... and never looked back. When all was said and done, the S&P 500 (SPX) (SPY) finished the week up 3.6%, having hurdled two key moving averages along the way.
And yet, the finish on Friday was anything but convincingly bullish.
This week could go either way, though it's worth noting that the BigTrends TrendScore for stocks was a solid 83.5 (out of 100) as of Friday close, pointing bullishly. Thanksgiving week is also usually a bullish one too, even if tepidly.
We'll run through it all, but first, let's work through some of the key economic numbers.
Economic Data
Last week wasn't a huge week for economic data. The biggest news was the release of the minutes from last month's meeting of the Federal Reserve's governors meeting. No curve-balls... but it does appear the Fed's leaders were even more gung-ho to ramp up rates this December than the market was even anticipating. As of Friday's close, traders are saying there's a 74% chance the Fed Funds rate will move to 0.5% (and only a 26% chance it will remain at 0.25%).
We also got a look at last month's consumer inflation rate. For the month, price grew 0.2% overall and on a core (ex-food and ex-energy) basis. But, don't jump to conclusions. On a year-over-year basis, the inflation rate now stands at 0.171% overall, and is still a tame 1.9% on a core basis. There's no serious inflationary pressure forcing the Fed to pump up rates.
Inflation Chart
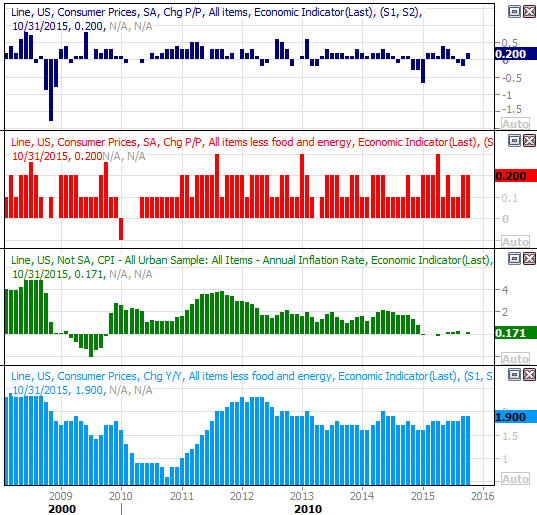
Source: Thomas Reuters
We also got an update on the home-construction front. Starts fell, but permits perked up. Both moves reversed September's moves. More important, in both cases, the longer-term trend is still an upward-pointing one.
Housing Starts and Building Permits Chart
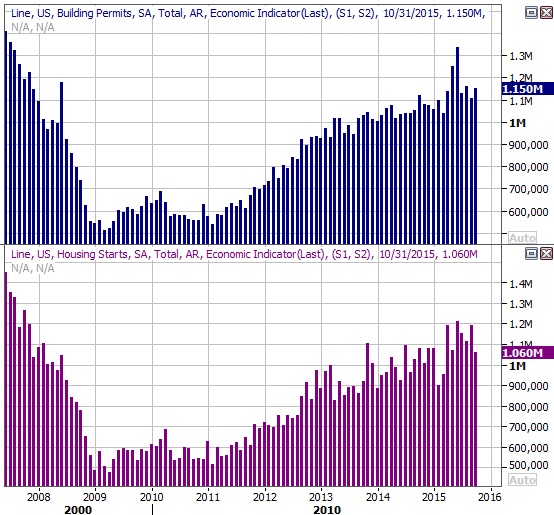
Source: Thomas Reuters
All the other data is on the following grid:
Economic Calendar
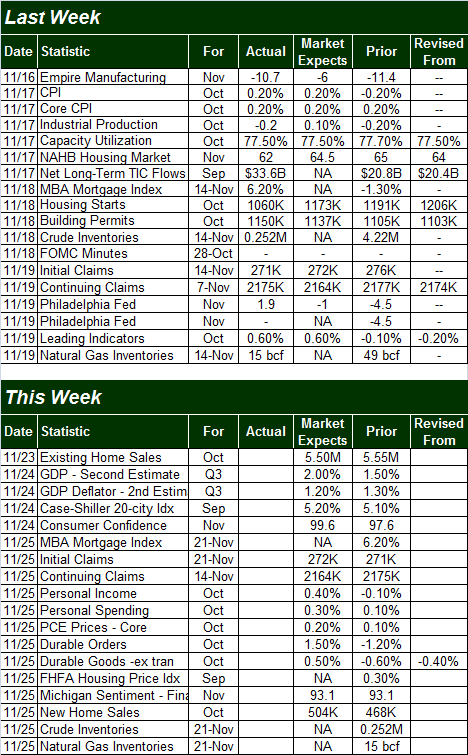
Source: Briefing.com
The coming week will be about as busy, but with everything crammed into the first three days of the holiday-shortened week.
It's going to be another big week for real estate data, with the NAR's existing home sales report for October due on Monday, and new homes sales due to be reported on Wednesday. Existing home sales have been particularly strong of late, offsetting a lull in new home sales. Both should remain strong for October, though.
New and Existing Home Sales Chart
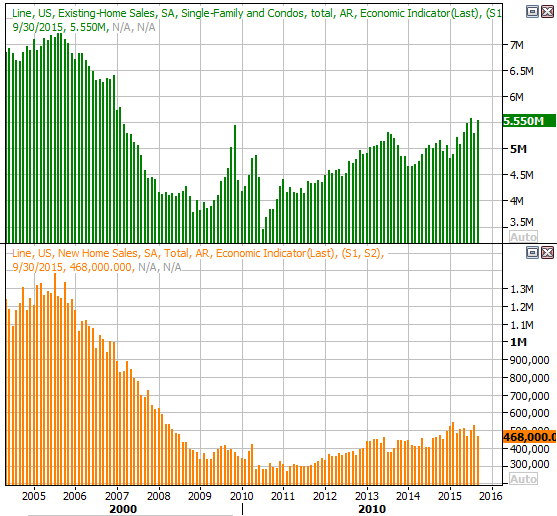
Source: Thomas Reuters
The biggie, though, is going to come in between, on Tuesday... the second estimate of Q3's GDP. Economists have ratcheted up their growth estimates from the first go-around, though even at 2.0%, it's not as if the economy is firing on all cylinders.
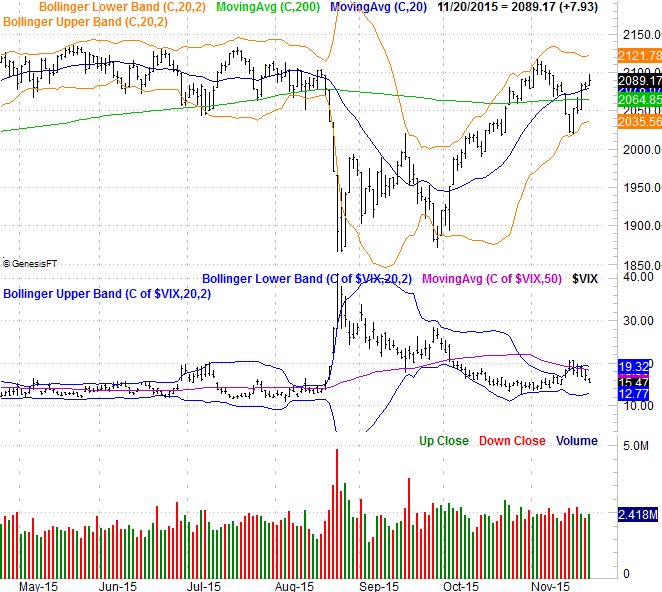
Stock Market Index Analysis
All things considered, we have to presume more bullishness is in the cards; the trend is your friend. On the other hand, we also have to assume this trend is going to hit a wall sooner than later.
On our daily chart of the S&P 500 below, we can see the 20-day Bollinger bands (orange) are going to continue containing the index, kick-starting reversals the vast majority of the times they've been tested. This has been bullish and bearish. Assuming this pattern will repeat itself, the S&P 500 may be able to continue rallying up to 2122, where the upper Bollinger band currently lies. Past that, it's a coin toss again (and even more of a coin toss considering that's near the point where the S&P 500 topped in early November).
S&P 500 & VIX Daily Chart
Chart created with Trade Navigator
You can also see the CBOE Volatility Index (VIX) (VXX) didn't move up past a couple of technical ceilings it was gunning for early last week. Instead, it started to peel back again, and still has room to keep falling before finding any kind of floor. This too suggests near-term bullishness is in the cards.
Zooming out to a weekly chart actually suggests the bullishness should be more than just a short-term surge.
Last week's railroad track reversal of the S&P 500 - where two tall bars are mirror images of one another, and the opens and the closes are at the opposite extreme ends of each bar - says the reversal is a strong one. And, thanks to August's sizeable stumble, there's still plenty of room for the index to keep moving higher before bumping into the upper 26-week Bollinger band, which has historically been the index's upper limit. [Note that the upper band may be the S&P 500's upper limit, but it doesn't necessarily spur pullbacks when it's touched.]
S&P 500 & VIX Weekly Chart
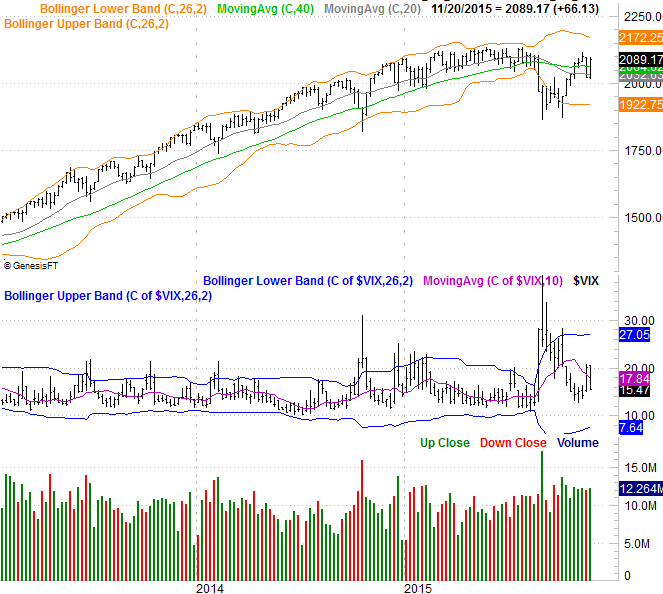
Chart created with Trade Navigator
The NASDAQ Composite's (COMP) daily chart doesn't look too different from the S&P 500's, though the lines in the sand are a little clearer on the NASDAQ than they are for the S&P 500. Namely, the composite has a key ceiling to contend with around 5180, while the Nasdaq Volatility Index (VXN) is en route to a pivotal floor at 13.1. If the market is going to roll over, that would be the ideal spot for the bears to start the pullback. If the bears happen to fail to send the NASDAQ lower then and there and the NASDAQ breaks through, there's not a lot - technically - that could hold the market back from a decent Santa Clause rally.
NASDAQ Composite & VXN Daily Chart
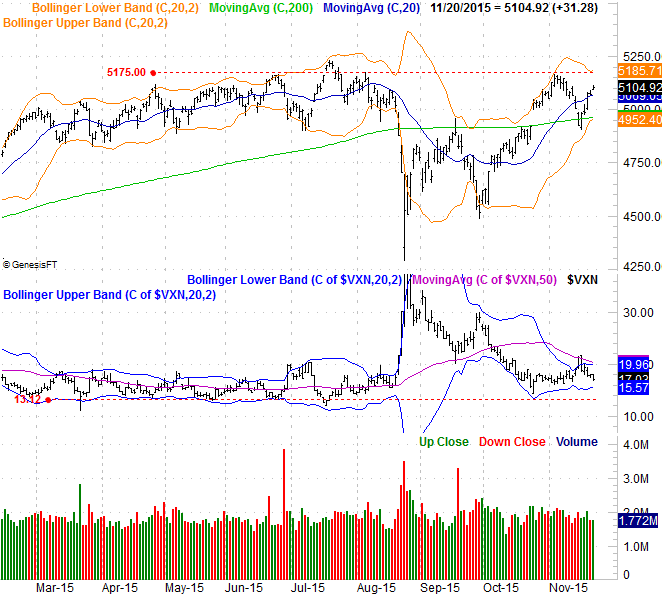
Chart created with Trade Navigator
The timing for the move into this make-or-break situation couldn't be better. Thanksgiving week is usually, though modestly, bullish for stocks, and the composite is only 1.5% below the ceiling at 5180 right now.
Though this week shouldn't be too volatile either way this week, where it finishes on Friday could make a great deal of difference in how it starts the show again in the following week.
Transportation Stocks Healthier Than Most
While most stocks in most industries have been pointed higher since early October after struggling in August and September, few industries are in stable, confirmed uptrends yet. Transportation stocks (IYT) aren't in a confirmed uptrend yet either, but the rally thus far is on surer footing than most any other sector or industry could claim. The downtrend was well-defined, as has been the break above a major falling resistance line (dashed) and the 100-day moving average line (gray).... which has been a key support and resistance level in the past.
Dow Jones Transportation Index Chart
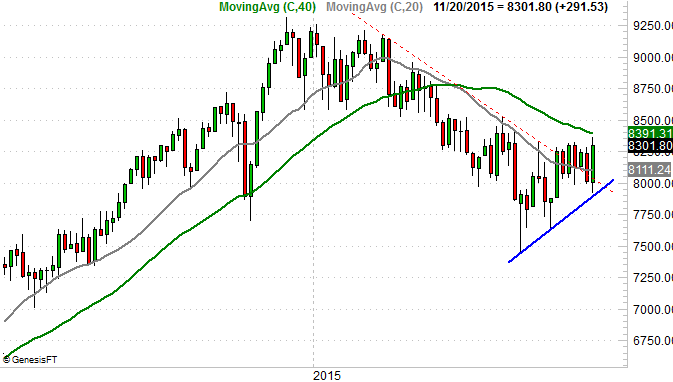
Chart created with Trade Navigator
The clincher will be a move above the 200-day moving average line (green) at 8391, but after last week's bullish outside reversal, such a move is likely.
It's worth noting, simply because it's one of the few firmly developing trends that isn't already overbought heading into the end of the year.
Trade Well,
Price Headley
BigTrends.com
1-800-244-8736