Weekly Market Outlook - Big Gain, But No Follow-Through
Last week got started with a bang... the bulls shoved stocks higher at Monday's open following the results from the first round of France's Presidential election, and news that Donald Trump's proposed tax plan would soon be unveiled. Those bulls were still in a buying mood on Tuesday too. By Wednesday though, the mood had soured - a few too many lackluster earnings reports. The momentum was completely gone by Friday, with stocks logging their worst day of the week that day. The S&P 500 only managed to test, and not surpass, its previous peak before giving up.
Was Friday's pullback just a little pre-weekend cleanup, with investors planning on rekindling the rally this week? Or, did the market just quietly throw in the towel? We'll look at the matter below, after a quick rundown of last week's and this week's economic news.
Economic Data
Last week was a rather busy one, beginning with a look at February's -- not March's -- home pricing data, which underscored the home purchasing data unveiled last week and the week before. Not surprisingly, it remains strong. The Case-Shiller index was up 5.9% on e year-over-year basis, and the FHFA Housing Price Index grew 0.8% month-to-month.
Case-Shiller and FHFA Home Price Indices Charts
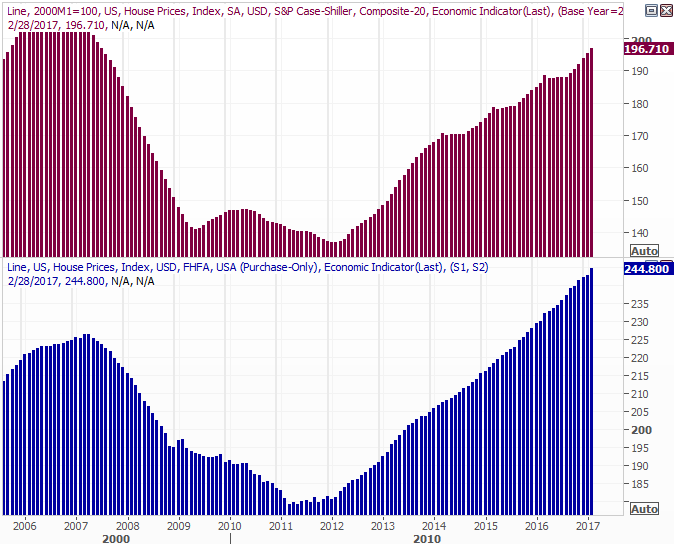
Source: Thomson Reuters
To that end, it's not surprising to learn Aprils sales of new homes were not only strong, but a blowout. After we learned sales of existing homes reached a ten-year high pace of 5.71 million houses two weeks ago, last week we heard sales of new homes also reached a multi-year high pace of 621,000 units.
Existing Home and New Home Sales, Inventory Charts
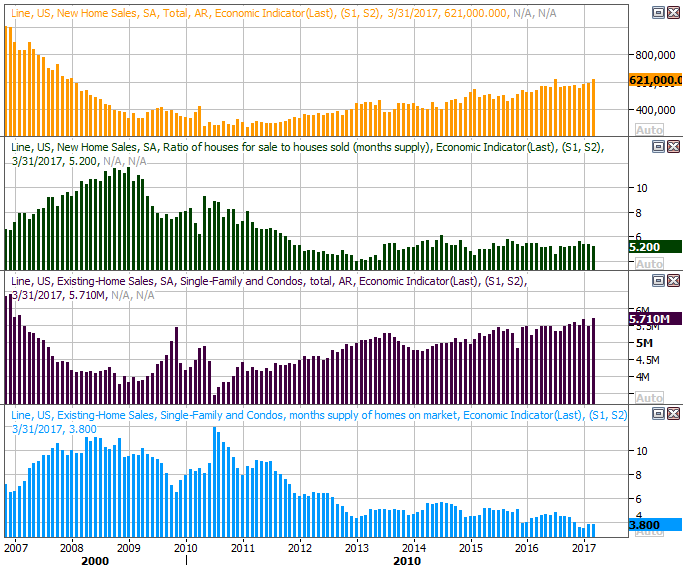
Source: Thomson Reuters
The real estate sliver of the economy is firing on all cylinders, even if some other parts of it are lethargic.
In light of the way consumers are clamoring to purchase houses, it almost goes without saying they're feeling good about the economy. Although last month's consumer confidence reading from the Conference Board fell and the Michigan Sentiment Index was basically flat, both are still in broad uptrends. (And, both were up against an oddly strong March reading.)
Consumer Confidence and Michigan Sentiment Charts
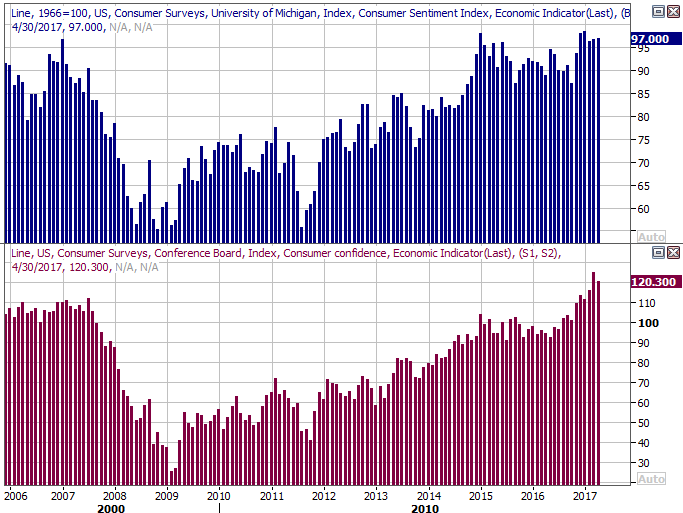
Source: Thomson Reuters
Finally, though it wasn't surprising, the initial reading on Q1's GDP growth rate was a mere 0.7%. In some regards it was an unfair comparison -- the GDP grew 3.5% in the same quarter a year earlier. And, a big piece of the tepid growth is attributable to a slowdown in auto sales, though car purchases are still above the long-term average. On a relative basis though, consumers and economists would like to see a stronger number.
GDP Growth Chart
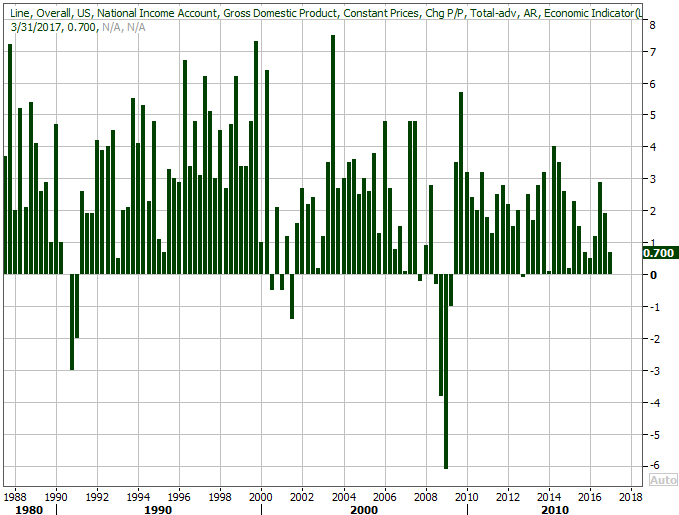
Source: Thomson Reuters
Everything else is on the grid.
Economic Calendar
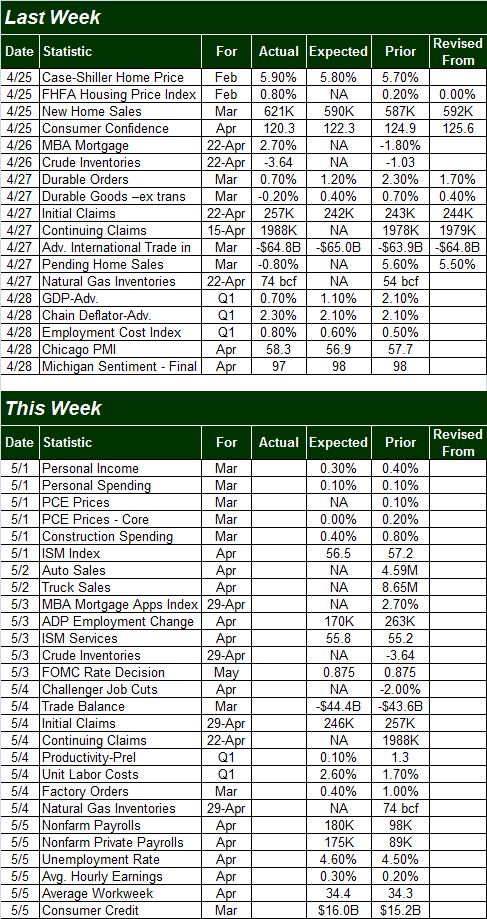
Source: Briefing.com
This week is going to be even busier in terms of economic announcements, though fewer of them are as hard-hitting as last week's news. The grand finale, however, is grand indeed.
This week we'll hear about last month's ISM readings.... service and manufacturing. Both have been above the critical 50 mark for quite some time, but neither has demonstrated upward growth. That's not expected to change this time around. Still, the ISM data indicates a positive economic environment.
ISM Index (Service and Manufacturing) Charts
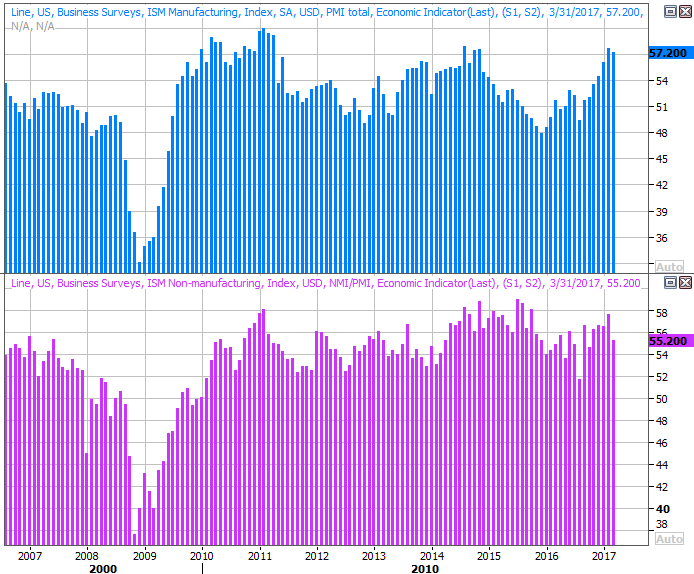
Source: Thomson Reuters
On Tuesday we'll be hearing all the major car manufacturers' reports on their sales activity for last month. You may recall March's tallies were alarmingly short of expectations. Automobile maker stocks may not survive another bad month.
Auto Sales (Total, Cars, Trucks) Charts
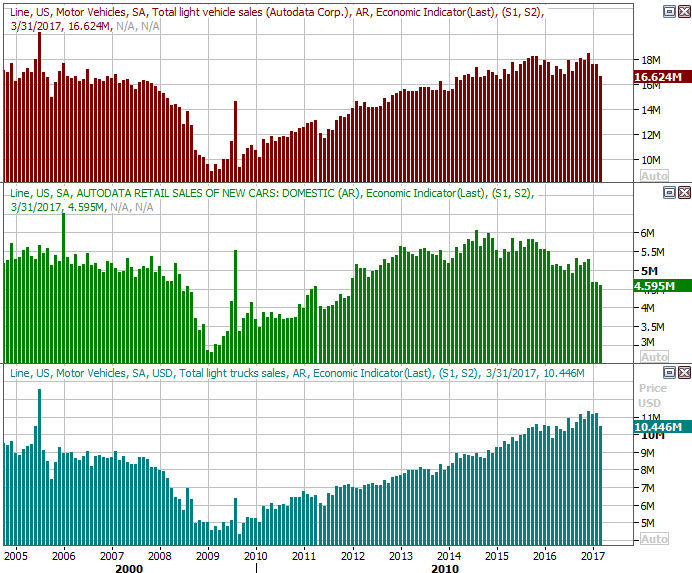
Source: Thomson Reuters
No chart is necessary to preview it, but do note that the Federal Reserve will be posting its decision regarding interest rates on Wednesday. No change is expected for the current base rate of 0.825%, though one can't afford to assume anything at this point. Mostly listen for the changes in language from the FOMC's prior statement regarding its assessment of the economy.
And, the aforementioned grand finale, of course, is Friday's unemployment and job growth report for April. Both have been in impressive trends overall, and are expected to remain in a bullish condition when last month's numbers are unveiled. Note there's not a lot more room for the unemployment rate to fall, though there is room for more and better job growth.... though not a lot more. The indication of real progress from here will be wage growth, since most people already have some sort of job. They're just not being paid as competitively as they could be.
Unemployment Rate and Job Growth Charts
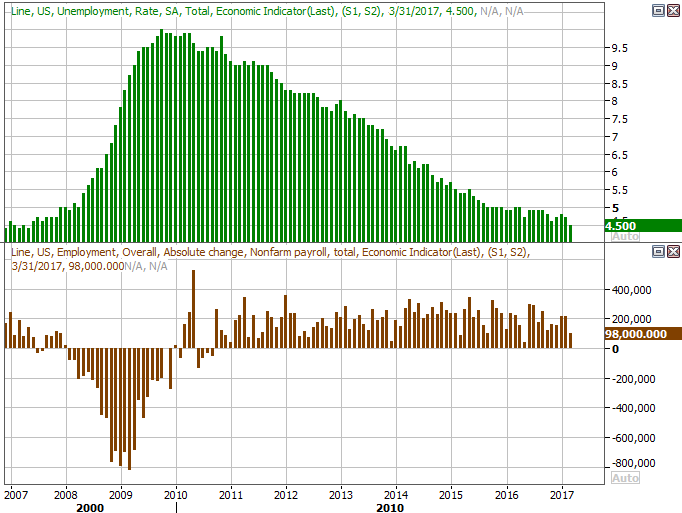
Source: Thomson Reuters
Look for a decent preview of the Department of Labor's job growth figure slated for Friday in Wednesday's employment change figure from payroll processor ADP.
Index Analysis
For a brief moment on Wednesday it looked as if the S&P 500 was going to make its way into new record-high territory. By the time Wednesday's closing bell rang though, the index had been pushed back from the brink of a move into new-high territory, and spent the latter half of the week retreating. It was a surprising reversal of the bullishness that was so rampant early on in the week following the results of the first round of France's Presidential election.
S&P 500 Daily Chart
Chart created with TradeNavigator
Maybe it was the simple fact that the S&P 500 left behind a bullish gap on Monday and Tuesday, and now traders are going back to fill them in. Or, maybe investors just have a problem with the market's valuation, and the index was going to roll over around 2400 no matter how it got there. Or, maybe traders were just doing some selling in before the weekend as a purely defensive measure.
Whatever the case, once again the market is squarely on the fence.
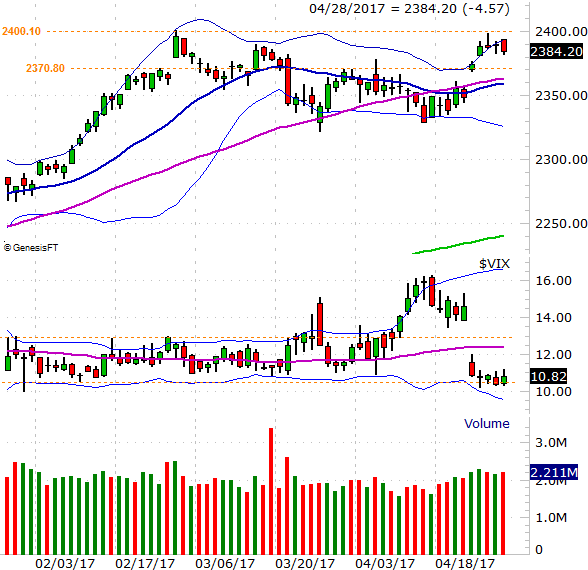
The bullish argument for the S&P 500 starts with the fact that it's above the 20-day (blue) and the 50-day (purple) moving average lines. Even if the index peels back a little, it will remain above those lines.
On the flipside, the bearish argument that points out the VIX is back at absolute low levels suggests there's no more psychological room for stocks to move any higher.
The daily chart of the NASDAQ Composite looks far more bullish than the S&P 500's does. Namely, the NASDAQ had no problem whatsoever making its way into new-high territory last week.
NASDAQ Composite Daily Chart
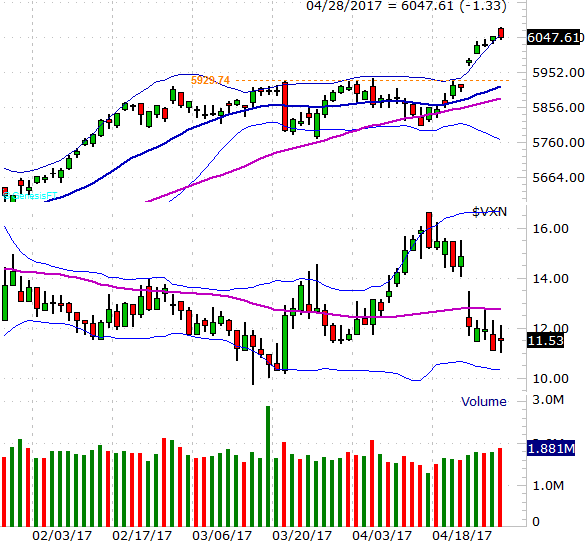
Chart created with TradeNavigator
That doesn't inherently mean the composite is well positioned to keep chugging higher. Like the S&P 500, the NASDAQ logged a gap on Monday and Tuesday, and those gaps are beckoning the NASDAQ lower again. The question is, where will any pullback stop? There's a ton of support developing around the 5930 area, where the prior ceiling was, and where the composite's 20-day and 50-day moving average lines will soon be.
Zooming out to a weekly chart of the S&P 500 and the VIX sheds a little more light on last week's disruptive action. In this timeframe we can see just how low the VIX is, and just how overextended the S&P 500 itself is.
S&P 500 Weekly Chart
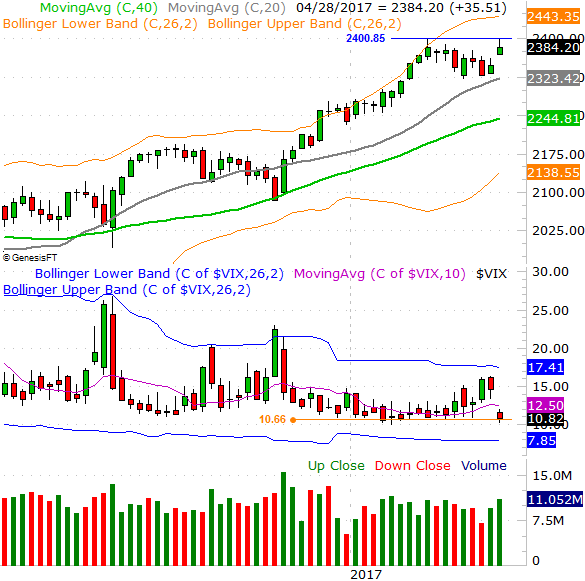
Chart created with TradeNavigator
With that as the backdrop, note that over the course of last week, the market's breadth and depth turned decidedly bearish, suggesting there were more sellers late in the week than there were buyers early in the week. The NYSE's up and down volume along with the NYSE's advancers and decliners -- all with their moving average lines included -- indicate the broad undertow is leaning bearishly. Makes sense, actually, given that May is usually a tough one for stocks, and the market's already overextended.
NYSE Advancers, Decliners, Up Volume and Down Volume Charts
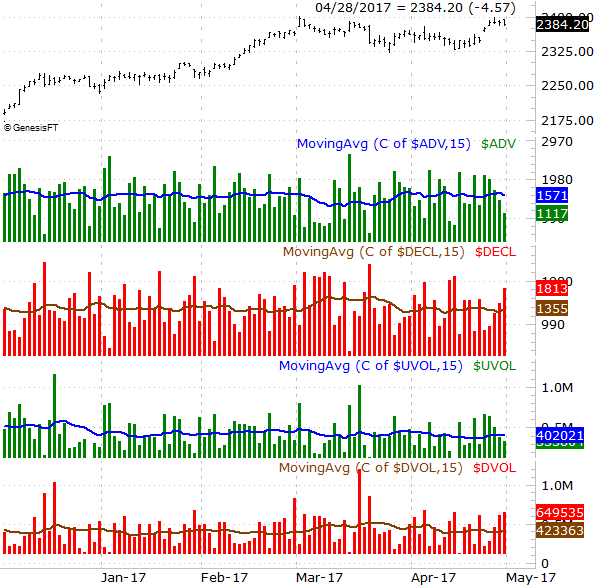
Chart created with TradeNavigator
Nevertheless, until the indices break below their 20-day and 50-day moving average lines, stocks technically remain in an uptrend. Just don't bet the farm, and certainly don't turn your back on the market. This is anything but a healthy, reliable bullishness.