Wall Street Analysts Predicting 10% SPX Rise Over Next 12 Months
Analysts Project 10% Price Increase for S&P 500
by John Butters, Senior Earnings Analyst
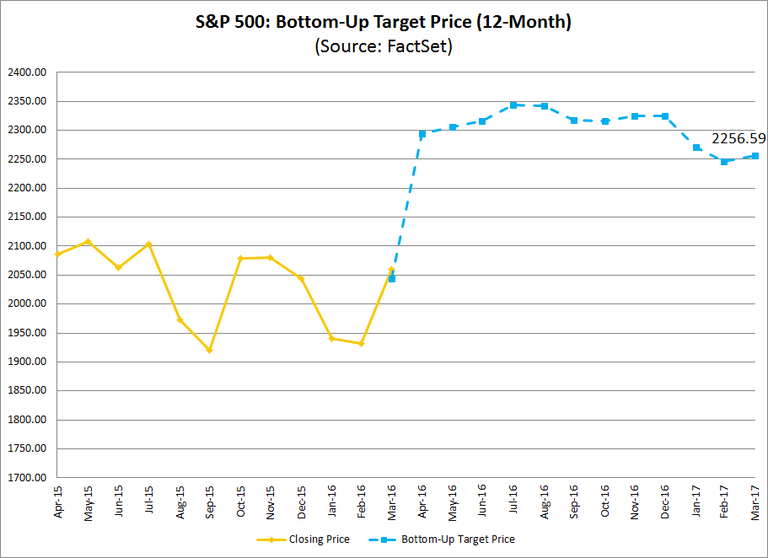
After hitting the bottom value for the year of on February 11 (1829.08), the S&P 500 index (SPX) (SPY) recorded an increase in value of 12.6% during the remainder of the quarter to finish the first quarter at 2059.74. Where do analysts believe the price will go from here?
Industry analysts in aggregate predict the S&P 500 will see a 9.6% increase in price over the next 12 months. This percentage is based on the difference between the bottom-up target price and the closing price for the index at the end of March. Aggregating the mean target price estimates (based on company-level estimates submitted by industry analysts) for all the companies in the index, the bottom-up target price for the S&P 500 was 2256.59 on March 31, which was 9.6% above the closing price of 2059.74.
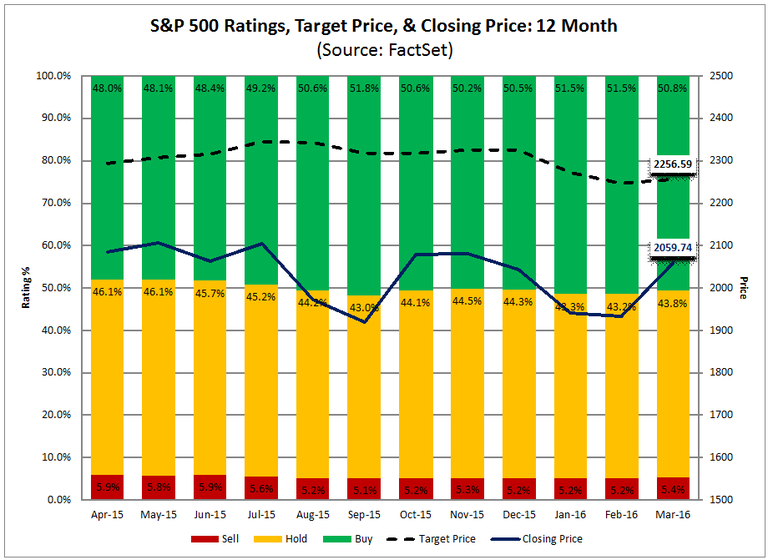
How accurate have the industry analysts been in predicting the future value of the S&P 500? Over the previous year (April 2015 to March 2016), the average difference between the bottom-up target price estimate at the end of the month one year ago and the final price for the index at the end of the same month one year later has been +6.8%. In other words, industry analysts on average have overestimated the final price of the index by 6.8% at the end of each month during the previous year.
Over the previous five years (April 2011 to March 2016), the average difference between the bottom-up target price estimate at the end of the month one year ago and the final price for the index at the end of that same month one year later has been +1.0%. In other words, industry analysts on average have overestimated the final price of the index by 1.0% at the end of each month during the previous five years.
Uptick in Sell Ratings During Q1
Of the 11,584 ratings on S&P 500 companies at the end of the first quarter (March 31), 50.8% were Buy ratings, 43.8% were Hold ratings, and 5.4% were Sell ratings. During the first quarter, the overall number of ratings increased by 0.2% (to 11,584 from 11,557).
The number of Buy ratings rose by 0.8% compared to Q4. Four sectors saw an increase in Buy ratings, led by the Health Care (XLV) (+8%), Financials (XLF) (+6%), and Telecom Services (XTL) (+6) sectors. Six sectors witnessed a decrease in Buy ratings, led by the Utilities (XLU) (-6%), Materials (XLB) (-5%), and Energy (XLE) (-5%) sectors.
At the company level in terms of Buy ratings, Chubb (CB) (+15) recorded the largest increase in the number of Buy ratings during the quarter, while Southwestern Energy (SWN) (-9) witnessed the largest decrease in the number of Buy ratings over this time frame.
The number of Hold ratings decreased by 1.0% relative to Q4. Three sectors witnessed a rise in the number of Hold ratings, led by the Health Care (+13%) sector. One sector (Materials) recorded no change in the number of Hold ratings. Six sectors witnessed a drop in the number of Hold ratings, led by the Information Technology (XLK) (-5%) and Consumer Discretionary (XLY) (-5%) sectors.
At the company level in terms of Hold ratings, Freeport-McMoRan (FCX) (+7) recorded the largest increase in the number of Hold ratings during the quarter, while Chubb (-11) saw the largest decrease in the number of Hold ratings over this time frame.
The number of Sell ratings increased by 4.8% relative to Q4. Eight sectors witnessed a rise in the number of Sell ratings, led by the Telecom Services (+40%) and Consumer Discretionary (+23%) sectors. Two sectors witnessed a drop in the number of Sell ratings, led by the Health Care (-15%) sector.
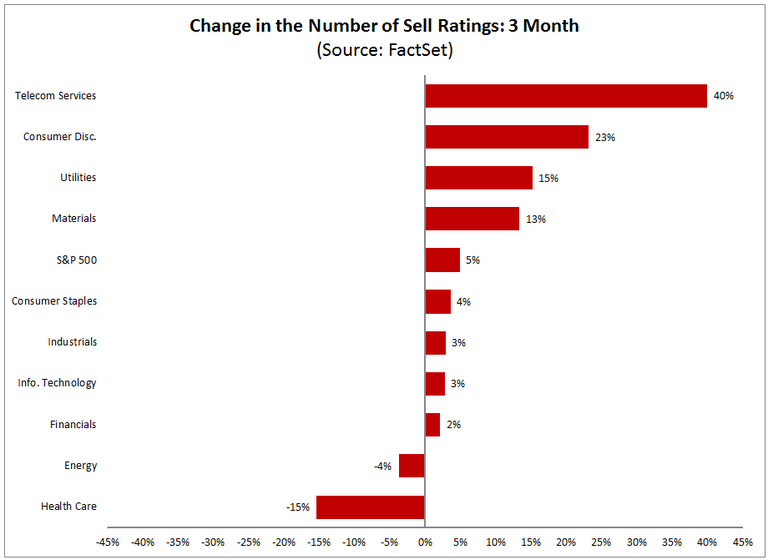
At the company level in terms of Sell ratings, Southwestern Energy (+6) and Chipotle Mexican Grille (CMG) (+5) saw the largest increases in the number of Sell ratings during the quarter, while Royal Caribbean Cruises (RCL) (-5) and Diamond Offshore Drilling (DO) (-4) recorded the largest declines in the number of Sell ratings during this period.
Analysts Most Optimistic on Health Care, Least Optimistic on Energy
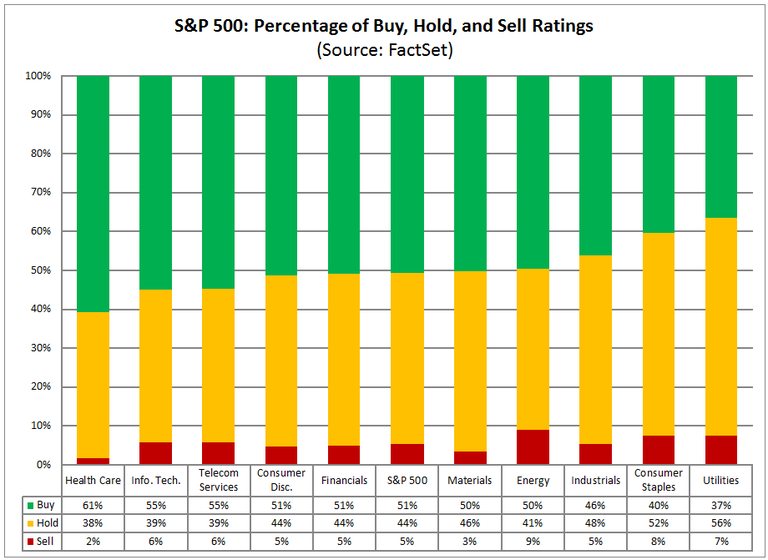
Overall, analysts are most optimistic on the Health Care sector, based on the percentage of Buy ratings at the end of March. The Health Care sector had the highest percentage of Buy ratings (61%) at the end of Q1. Over the past 12 months, the average percentage of Buy ratings for the Health Care sector has been 60%, which is the highest of all 10 sectors. On the other hand, the Utilities sector continued to have the lowest percentage of Buy ratings (37%) of any sector. Over the last 12 months, the average percentage of Buy ratings for the Utilities sector has been 38%, which is the lowest average of all 10 sectors.
Analysts are most pessimistic about the Energy sector, based on the percentage of Sell ratings at the end of March. The Energy sector had highest percentage of Sell ratings (9%) of all 10 sectors. The average percentage of Sell ratings for the Energy sector has been 10% over the past twelve months, which is the highest average of all 10 sectors. On the other hand, the Health Care sector had the lowest percentages of Sell ratings (2%). Over the last 12 months, the average percentage of Sell ratings for the Health Care sector has been 2%, which is the lowest average of all 10 sectors.
Industry Analysts Project 9.6% Increase in Price
The bottom-up target price for the S&P 500 is calculated using the same methodology to calculate the price of the index, except the closing price of each company is replaced with the mean target price for each company. The mean target price for each company is then multiplied by the float shares outstanding for that company. The numbers for all the constituents are then aggregated and divided by the index divisor.
At the end of the first quarter, the bottom-up target price for the S&P 500 was 2256.59, which was 9.6% above the closing price for the index of 2059.74. Over the past 12 months, the average difference between the bottom-up target price and the closing price has been 13.5%.
Over the past quarter, the bottom-up target price decreased by 2.9% (to 2256.59 from 2325.79), while the price of the index increased by 0.8% (to 2059.74 from 2043.94).
At the end of March 2015 (one year ago), the bottom-up target price was 2261.87. Compared to the actual closing price of 2059.74 at the end of March 2015, industry analysts overestimated the price of the index by 9.8% one year ago. Over the past 12 months, the industry analysts have overestimated the price of the index at the end of each month by 6.8% on average. Over the past five years (60 months), the industry analysts have overestimated the price of the index at the end of each month by 1.0% on average.
At the sector-level, the Health Care sector had the largest upside difference between the bottom-up target price and the closing price (+18.2%), while the Telecom Services sector had the largest downside difference between the bottom-up target price and the closing price (-2.5%).
Courtesy of factset.com