
The Rest of the Unemployment Rate, Job Growth Story
As is usually the case on the first Friday of every month, today, the Department of Labor released last month's jobs report -- namely, the official unemployment rate and the number of new jobs (net) created in the prior month. January's primary numbers were mostly good. The unemployment rate fell from 5.0% to a multi-year low reading of 4.9%, and though the number wasn't as strong as hoped, the economy did add 151,000 new jobs in January.
The two numbers most commonly touted in the headlines, however, hardly tell the whole story. A closer look at the rest of the numbers provides a much deeper perspective on the true health of the jobs market.
With that as the backdrop...
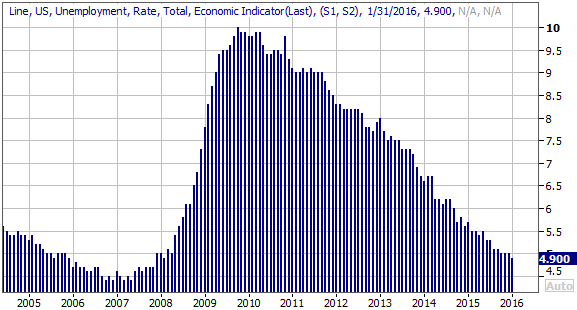
The core data isn't bad. The lowered unemployment rate of 4.9% simple extends what's been a string of lower unemployment going back to 2010. For reference, the lowest unemployment rate from 2007 was 4.4%.
Unemployment Rate Chart
Some argue that the stated unemployment rate isn't necessarily an accurate figure, as it doesn't properly count the number of people who'd like to have a job, but aren't currently - officially - unemployed. There's some truth to that, though not nearly as much as the critics would suggest.
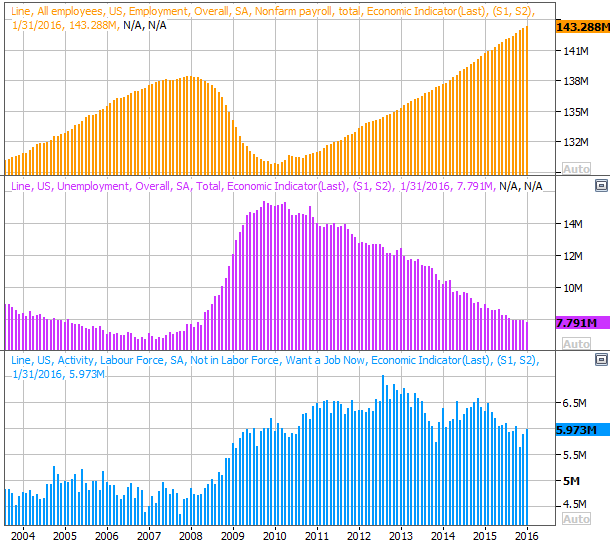
As of January, 143.28 million people in the U.S. were employed, up 140,000 from December's tally of 143.14 million. Conversely, only 7.79 million workers were counted as unemployed, down 110,000 from December's reading of 7.9 million. [No, neither of those figures are the stated payroll growth rate of 151,000, but the DOL inexplicably uses different sets of numbers to calculate their data. It's still close enough to paint the bigger picture though.] And, though the number of people not being officially counted as unemployed grew 90,000 from 5.88 million to 5.97 million, that figure is still broadly trending lower.... though still well above the 2007 low reading of 4.35 million.
Employed, Unemployed, Not In Labor Force Chart
Perhaps the real litmus test is the labor market's raw participation rate, which simply considers what percentage of the population is working, and what percentage of the population is even in the labor market (working or not). This figure should have a consistent mean, or average, though we also have to make a mental adjustment know the population is now top-heavy, with a swell of retirees - the baby-boomers - no longer in the job market. That said, there are still structural limits to how much of the U.S. population isn't interested in working.
In that light, it's encouraging to see the civilian employment-to-population ratio continue a steady rise that's been underway since 2011. This metric compares the number of people employed to the number of people living in the U.S., confirming that we're at least making some real progress on the jobs front. As of last month, 59.6% of the population has a job, which is the highest reading since 2009 when the rate was on its way lower.
Employment/Population Ratio & Labor Force Participation Rate Chart
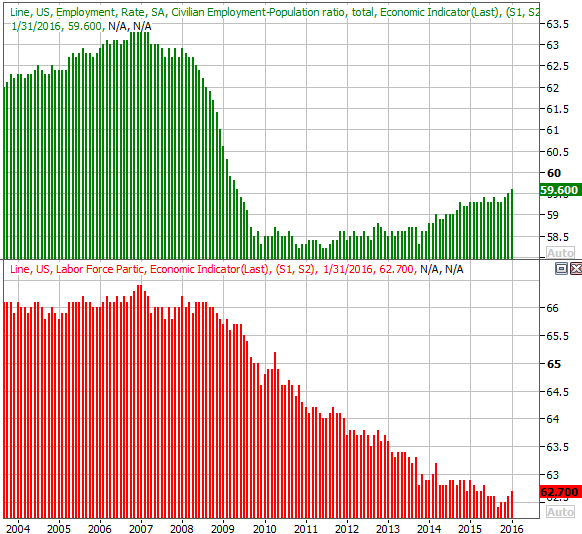
The similar labor force participation rate compares the number of people in the workforce - working or not - to the total population. It's still falling, but this is where the mass retirement of the baby-boomers will show itself... and it is. Still, a labor force participation rate of 62.7% is historically low, though even on this front we can see hints that the tide is slowing down. Perhaps that's a precursor to a sustained improvement.
The point is, while the naysayers can criticize the raw unemployment rate as being a misleading figure, there are several other inarguable data sets that point to similar strength in the jobs market. It's still not outstanding by any means , but it is pointed in the right direction.