In Bloom?
Are we going to break out for real this spring? Markets around the world seem to be in bloom. It’s hard to trust it, given how badly the last two “failed moves” ended – last August and this January-February were monumental corrections, notable for their lightning speed.
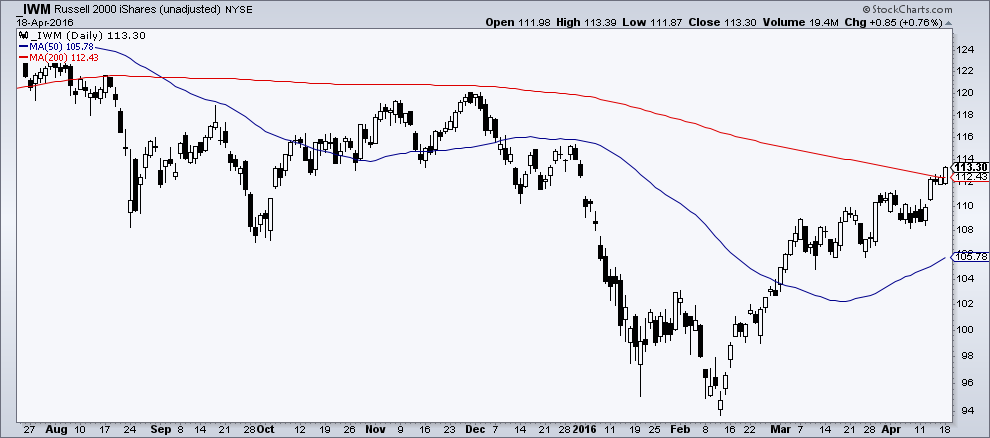
This week the Dow Jones Industrial Average (INDU) (DIA) retook 18,000 for the first time since last summer. Small cap stocks (IWM) are approaching a break above their 200-day moving average for the first time this year, as you can see below.
Market commentators often cite moves in small caps as being indicative of investor risk appetites. I’m not so sure that’s true anymore, given how many smart beta strategies that are, blindly allocating to low market-cap stocks each day.
Let’s look around the world…
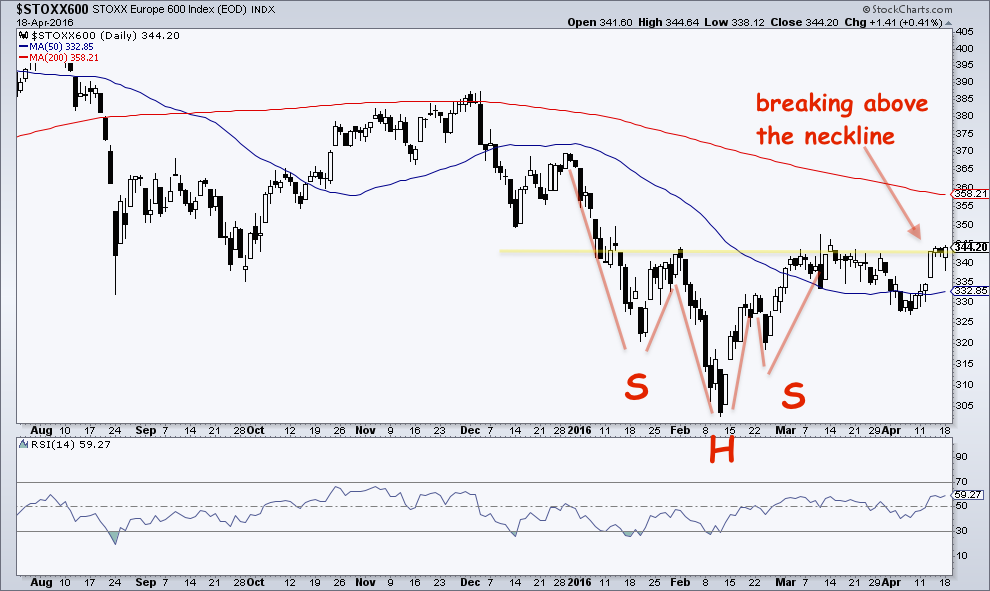
Here’s the EuroStoxx 600 index putting in a pretty clear inverse head-and-shoulders pattern. You can see it breaking above the neckline in my chart below. This is said to be a reversal pattern, meaning when it appears, it could serve to reverse the prior trend (which was down). Inverse head-and-shoulders patterns are created by a shift in sentiment – when sellers stop selling at a higher level than they had previously, thus creating the right shoulder as distinct from the lower head. You don’t have to “believe in this stuff,” because plenty of people do.
Or we could crack a serpent’s egg into a bowl of blood and then stir it with a pinky nail. What do you want me to tell you…
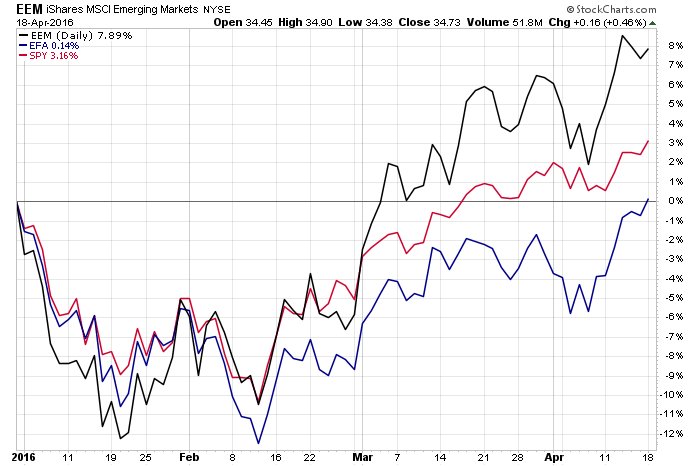
And how about this one: Emerging markets (EEM) vs foreign developed markets (EFA) vs the US large caps (SPX) (SPY) year-to-date – when was the last time the race looked like this?
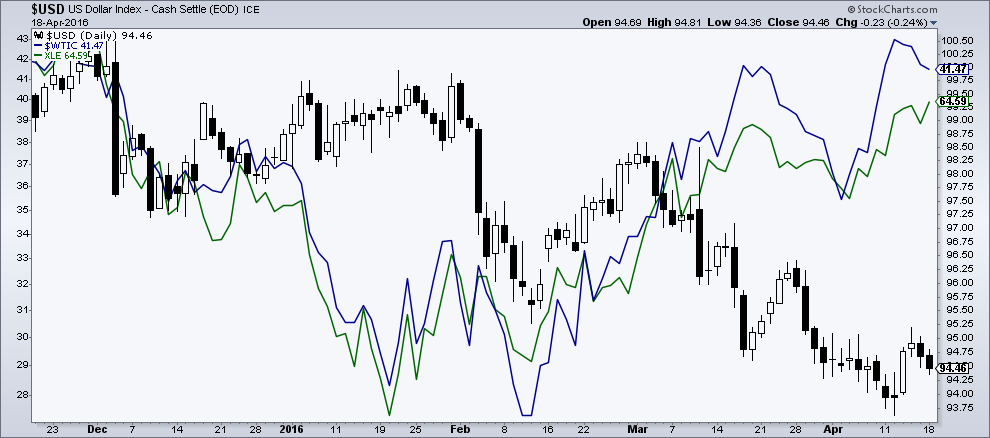
One more – here’s the US dollar index (UUP) (candlesticks) versus crude oil (USO) and the energy stocks (XLE) (in blue and green) since the dollar’s peak last December- look at that crossover.
These charts are supportive of a breakout to new highs for US stocks and an end of the downtrend at least for international markets. But again, we’ve been fooled before.
One group that seems to want to bet on a breakout here are the hedge funds.
Jill Carrey Hall and Savita Subramanian of Bank of America Merrill Lynch’s Equity and Quant Strategy team relay the fact that last week, firm clients on the whole were sellers of stocks, as they have been for 12 straight weeks now. But when broken down into client segments, you can see that hedge funds became net buyers for the first time in 9 weeks.
This comes after the biggest quarterly bout of hedge fund stock selling on record:
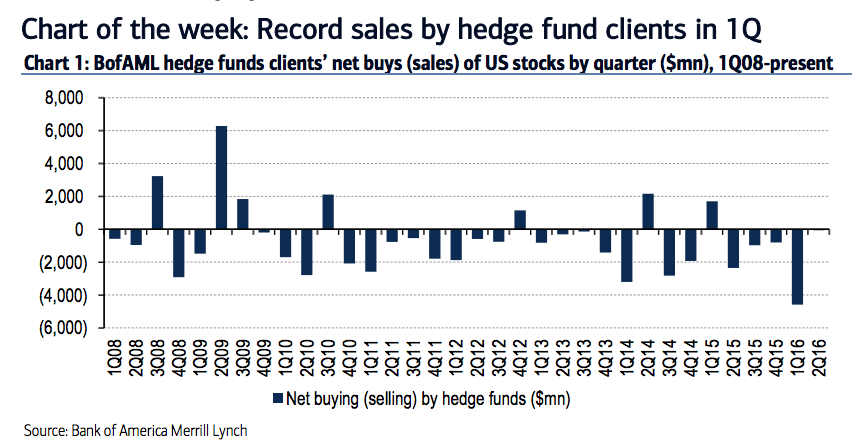
My guess is that a lot of Q1’s hedge fund selling was tied to redemptions, with volatility and the blow-ups of several well-known managers playing a role.
One last thing worth mentioning here – you will hear a lot about how the fundamentals don’t justify new highs. That “we don’t deserve” to break out of the range because of earnings, geopolitics, monetary policy, economic data, etc. And maybe that’s true. But, as Clint Eastwood said in Unforgiven, “Deserve’s got nothing to do with it.”
Because markets don’t trade on fundamentals, they trade on expectations and sentiment. The good news for the bulls is that expectations and sentiment have been pretty low. Despite having an S&P 500 that’s within 3% of all-time record highs, you’d be hard-pressed to find many people who are at all enthusiastic about it. In fact, the predominant emotion these days is suspicion. Suspicion of buybacks being the only driver. Suspicion of Janet Yellen having hatched a secret dollar deal with her counterparts in Europe, Japan and China, suspicion that it’s all algos and ETF flows moving stocks up, ignoring valuations and earnings entirely.
But this sentiment appears to be changing. Fear looks to be morphing into greed. Citi analysts keep a pair of global risk aversion indices capturing the mood across asset classes. Here’s what’s going on:
"Our two risk aversion indices – GRAMI and EMRA – are available on Bloomberg via the tickers CIGMGRAM Index & CIGMEMRA Index, respectively. GRAMI (Global Risk Aversion Macro Index), a global measure of risk aversion across asset classes decreased last week signalling an improvement in risk appetite. EMRA (Emerging Market Risk Aversion Index) also decreased signalling a slight increase in EM specific risk appetite (Figure 1 & Figure 2)."
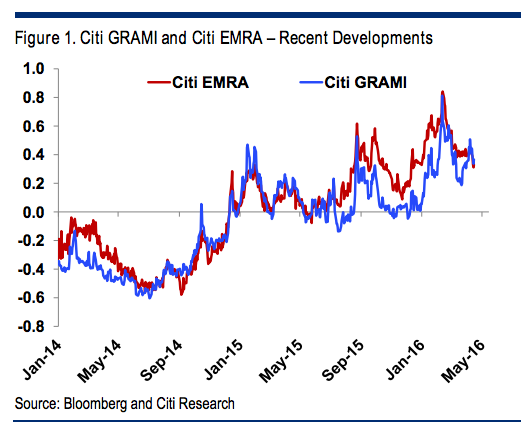
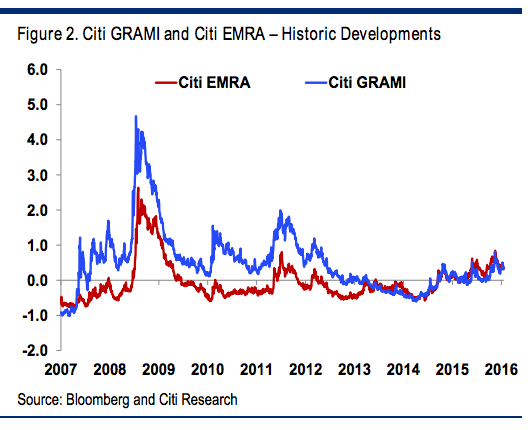
You can see an ever-so-slight drop-off in risk aversion happening around the world in these charts. Historically, this has led to some wicked rallies as they’ve crossed below the zero-line.
So, what’s it gonna be? Is this the moment we get the next leg higher?
Courtesy of philstockworld.com