Weekly Market Outlook - Traders Will Have to Show Their Cards Soon
 More of the same from the market last week, which is neither a good thing or a bad thing. Stocks have been stuck in a narrow sideways trading range since mid-December, and that's yet to change. Indeed, if anything the range has become slightly tighter.
The good news is, the indices are reaching a point where there's not a lot more opportunity to do nothing - one side or the other will have to play their hand soon. The bad news is, the scales could still easily tip in either direct
We'll weigh the odds below, as always. First though, let's paint some broad brush strokes using last week's and this week's economic news.
Economic Data
We went through a fair amount of economic information last week, but there were three stand-out data nuggets... last month's inflation data, December's capacity utilization, and last month's housing starts and permits. In order of appearance....
We already knew prices were on the rise after we got December's producer price inflation numbers two weeks ago. That reality was confirmed last week with last month's consumer inflation report. It was up a bit overall, with or without food or energy factored in. Perhaps more telling is that the annualized inflation rates -- all of them -- are not only at the Fed's ideal/target levels, but still rising fast. The Federal Reserve needs to put the brakes on this soon, before it reaches unwieldy levels.
Producer and Consumer Inflation Rate Charts
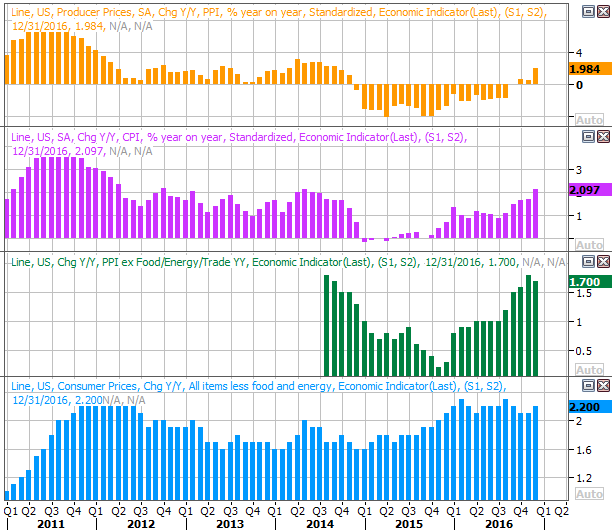
Source: Thomson Reuters
Last month's industrial activity was a pleasant surprise. Production was up a bit, as was capacity utilization; they both needed a bullish jolt. One month of progress doesn't mean a new trend is in place, but last month's modest advance offers some much-needed encouragement.
Industrial Productivity and Capacity Utilization Charts
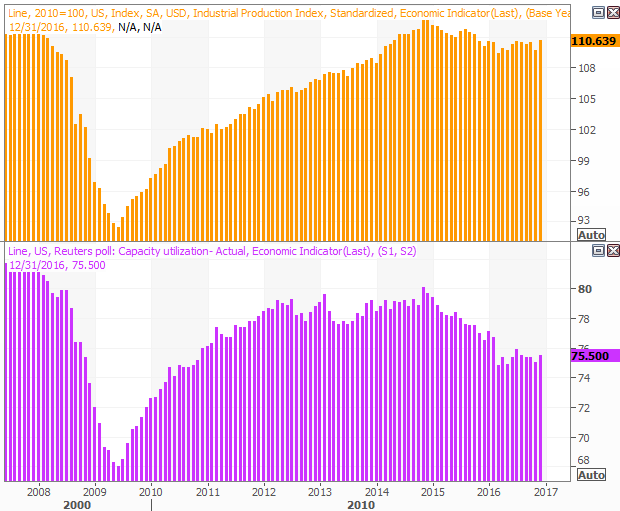
Source: Thomson Reuters
These two pieces of data correlate very well with the long-term market, so a couple more improvements for each is a big bullish clue. This is a start though.
The bulk of the weakness seen in the capacity utilization data since 2014 is related to the implosion of oil prices and the subsequent struggle from oil and gas stocks.
Finally, last month's housing starts and building permits were good.... well, starts anyway. Still, both continue to make forward progress, even among the occasional red flag for the housing market.
Housing Stars and Building Permits Charts
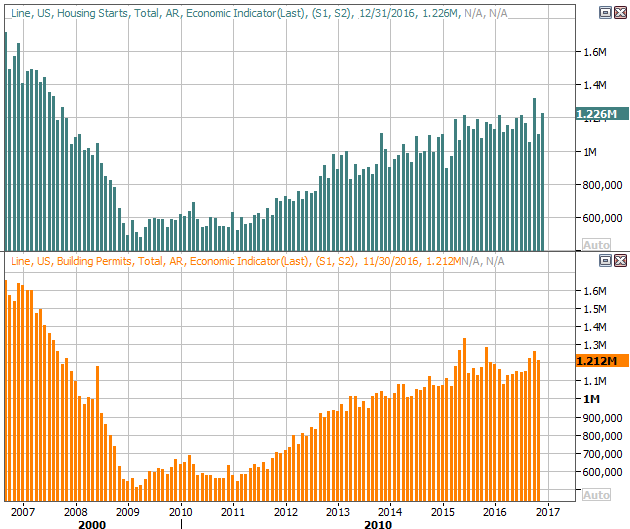
Source: Thomson Reuters
Real estate continues to be one of the market's brighter spots, despite the naysaying.
Everything else is on the grid.
Economic Calendar
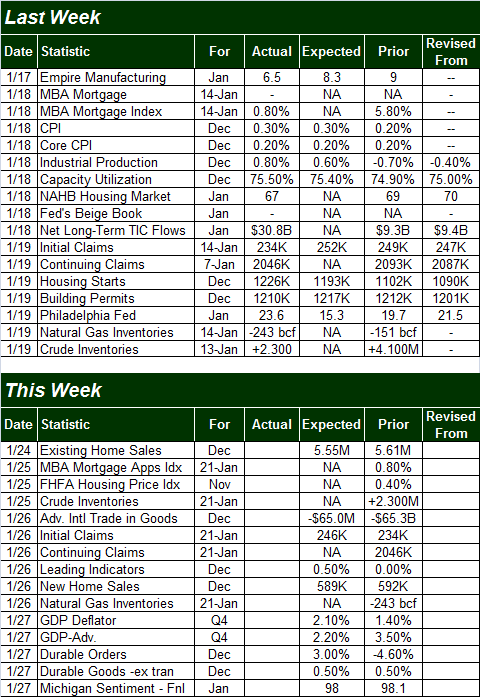
Source: Briefing.com
This week won't be quite as busy, but a couple of data sets deserve a closer look.
First, this is another huge week for real estate. Existing home sales for December will be announced on Tuesday, and new home sales will be unveiled on Thursday. Both have been moving higher since 2010, and though experts believe we went through a slight lull last month, the bigger trend remains bullish.
New and Existing Home Sales Charts
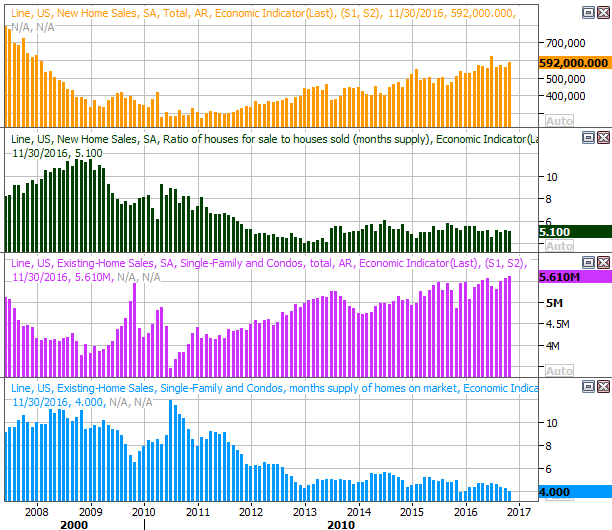
Source: Thomson Reuters
The other item worth previewing is Friday's GDP report... the first Q4 estimate. Economists expect Q3's red-hot growth pace of 3.5% is expected to slow to a pace of 2.2% growth. That's still not bad, but could be viewed as a letdown. Conversely, an early 'beat' of expectations could light a fire under stocks.
GDP Growth Charts
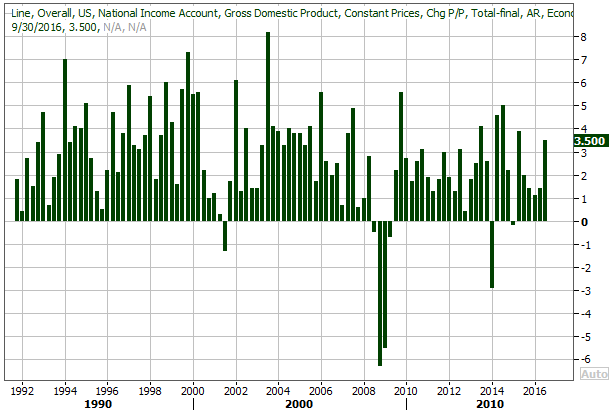
Source: Thomson Reuters
Index Analysis
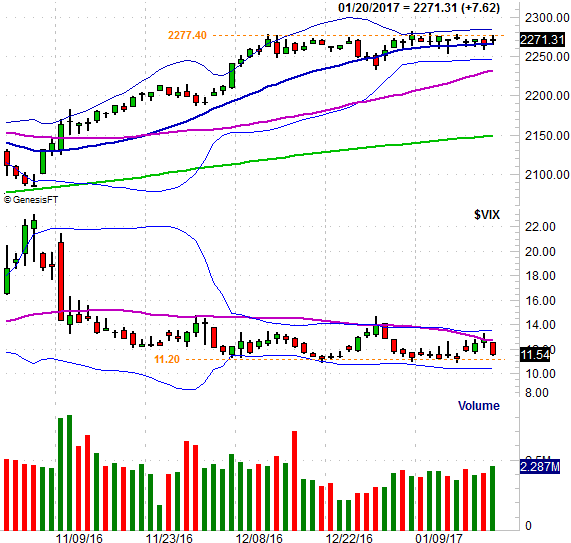
If there was any doubt the S&P 500 was struggling with a horizontal ceiling around 2277, it was wiped away last week. Conversely, it also became clear last week that the 20-day moving average line -- currently at 2265 -- is a technical support level. The good/bad news is, those two boundaries are close to converging, and traders are going to have to make a decision soon. Whichever line breaks first, look for a pretty decent swing in that direction.
S&P 500 Daily Chart
Chart created with TradeStation
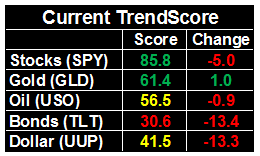
As the BigTrends TrendScore table above noted, things are still decidedly bullish for stocks, but that may be a relatively hollow bullish reading. A look at the S&P 500's PercentR line and its MACD line both say the undertow is weakening even if the index itself visibly looks like it's holding its ground.
S&P 500 Daily Chart, With Percent and MACD
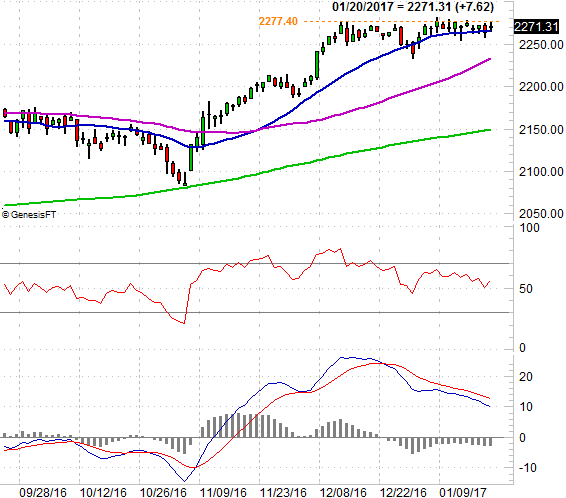
Chart created with TradeStation
Zooming out to a weekly chart of the S&P 500 we can see something else that's working against the S&P 500 (and by extension, working against the whole market) - the bump into a technical resistance line (brown, dashed) that tags all the major peaks going back to the one from April of last year suggests the rally has cooled for a while. It's also on the weekly chart we can see just how low the VIX is... it's at the ultimate floor that's been in place for years. The index can rally with the VIX this low, but it rarely rallies well. Throw in the fact that the S&P 500 is still nearly 16% higher than its 200-day moving average line (green) - which is about its historical limit - and you've just got a very brisk headwind.
S&P 500 Weekly Chart
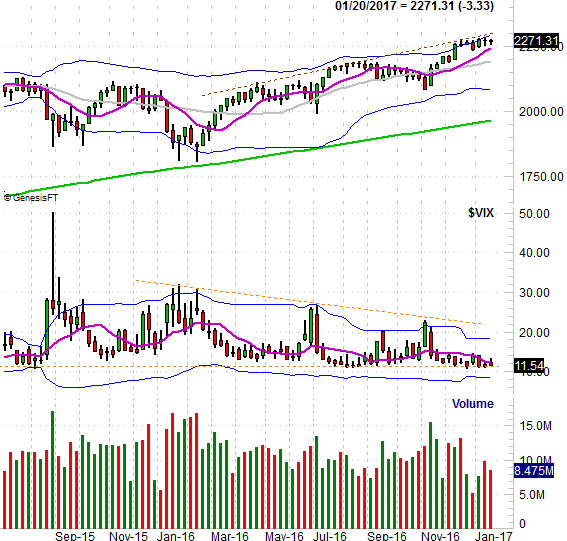
Chart created with TradeStation
The chart(s) of the NASDAQ look about the same, and point to the same indecisiveness.
The odds and undertow suggest downside is looming, but there's an X-factor that doesn't show up on any of the charts above. That is, the tendency to see bullishness after a Presidential inauguration. It doesn't last terribly long. In fact, the February falling an inauguration rally is usually a rather nasty one. Nevertheless, the tendency calls for at least a few days of bullishness. Should the S&P 500 break above 2277 this week, we may well get that usual action, but that rally may also serve as the setup -- a fakeout -- for an overdue pullback.
Just be prepared for anything. There's not much room left in the narrowing trading range the S&P 500 finds itself in right now, and once it finally breaks, a lot of pent-up activity could be unleashed in a hurry.