'Sell in May and Go Away' is a Real Thing, But...
Most everyone has heard the term 'sell in May and go away,' but not everyone necessarily believes in the premise enough to abide by it. Nothing wrong with that -- many of the market's presumed truths end up being false when really put to the test. As it turns out though, the whole 'sell in May' thing is for real. Crunching the numbers reveals that in almost all cases, you're better off out of the market than in it for the coming month. However, there's a big caveat. A handful of big caveats, actually.
Going back to the very beginning of the S&P 500's existence, on average, the large cap index slides 0.2% for the month about to begin. That makes it only one of two losing months, on average, for stocks. (September is the other usual loser.)
The inherent problem with these averages is that a few anomalous outlier months can really skew the overall average. That's not what's happening in this particular case though.
The facts: In 57% of the Mays since 1928, the S&P 500 has made a gain of some size, which means 43% of the time, it's lost ground. That's still a net winner, but not by much for a market that's supposed to go up.
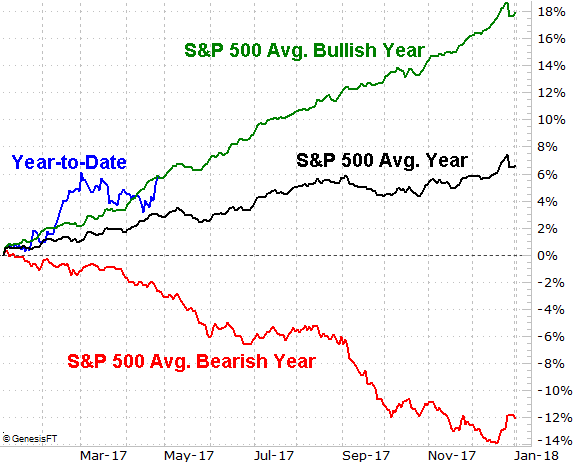
Where things get real interesting, however, is when you break out the good years from the bad.
Not surprisingly, in a bearish year -- as measured by a net loss from the beginning of the year to the end -- the S&P 500 loses an average of 3.0% in May. Yet, even in a bullish year -- as measured by a gain between the beginning and the end of it -- the S&P 500 only gains 1.3%. That's still technically a win, but note a nuance about the month even when the broad trend is bullish... between the end of the first full week and the end of the third full week, the index still loses about half a percent of its value. That's a big part of the May weakness most everyone tries to avoid, if at all possible.
Note that where the S&P 500 is year-to-date is right where it usually is in what's amounting to a net-bullish year. This suggests we're well positioned for the typical May, which starts bullishly and ends bullishly, but is notably weak in the middle.
Also note that while May is weak usually no matter what, it's sandwiched by a bullish April and a bullish June. Though the middle of the year aren't generally red hot ones for the market, more often than not they're net-bullish if you can stand the boredom. The trouble worth avoiding doesn't really begin until December, and even then that tepidness doesn't last very long.