October has about a week left in it now, and this 'scary' month has actually seen the market rebound, with the S&P 500 (SPX) (SPY) up 6%+ month-to-date (mtd).
Looking at the exchange traded fund (ETF) landscape, there's some interesting names on the top and bottom performers. We're looking at ETFs that have over 500k average daily volume and are optionable/shortable. We also are looking for non-overlapping pure sector plays, no inverse/ultra/bear ETFs in this group.
The Winners
October's top ETF winners include:
| Indonesia | (EIDO) | 24.05% |
| Gold Miners | (GDX) | 21.57% |
| Semiconductors | (SMH) | 13.89% |
| South Korea | (EWY) | 13.31% |
| Brazil | (EWZ) | 12.77% |
| Greece | (GREK) | 12.26% |
| Russia | (RSX) | 11.45% |
| China | (FXI) | 11.33% |
| Energy | (IYE) | 11.32% |
| South Africa | (EZA) | 11.28% |
Many of these top gainers could be attributed to a rebound in commodities like Gold (GLD) and Crude Oil (USO).
iShares MSCI Indonesia Investable Market Fund ETF (EIDO) is at the top of the heap for October and an interesting name not normally seen among the leaders. This ETF holds a variety of Indonesian companies. The most recent holdings data shows 50.7% of the ETF are in its Top 6 holdings (3 of which are banks):
Bank Central Asia (BBCA) 12.1%
Telekomunikasi Indonesia (TLKM) 10.1%
Astra International (ASII) 9.2%
Bank Rakyat Indonesia (BBRI) 8.7%
Bank Mandiri (BMRI) 6.3%
Unilever Indonesia (UINVR) 4.3%
The rest of the stock holdings in EIDO are below 3% individually.
Looking at the EIDO long-term chart below (encompasses all the data since the ETF's inception), you can see below that the ETF peaked in 2013, then entered a range in much of 2014, before moving to new lows this year.
EIDO Long-Term Weekly Chart
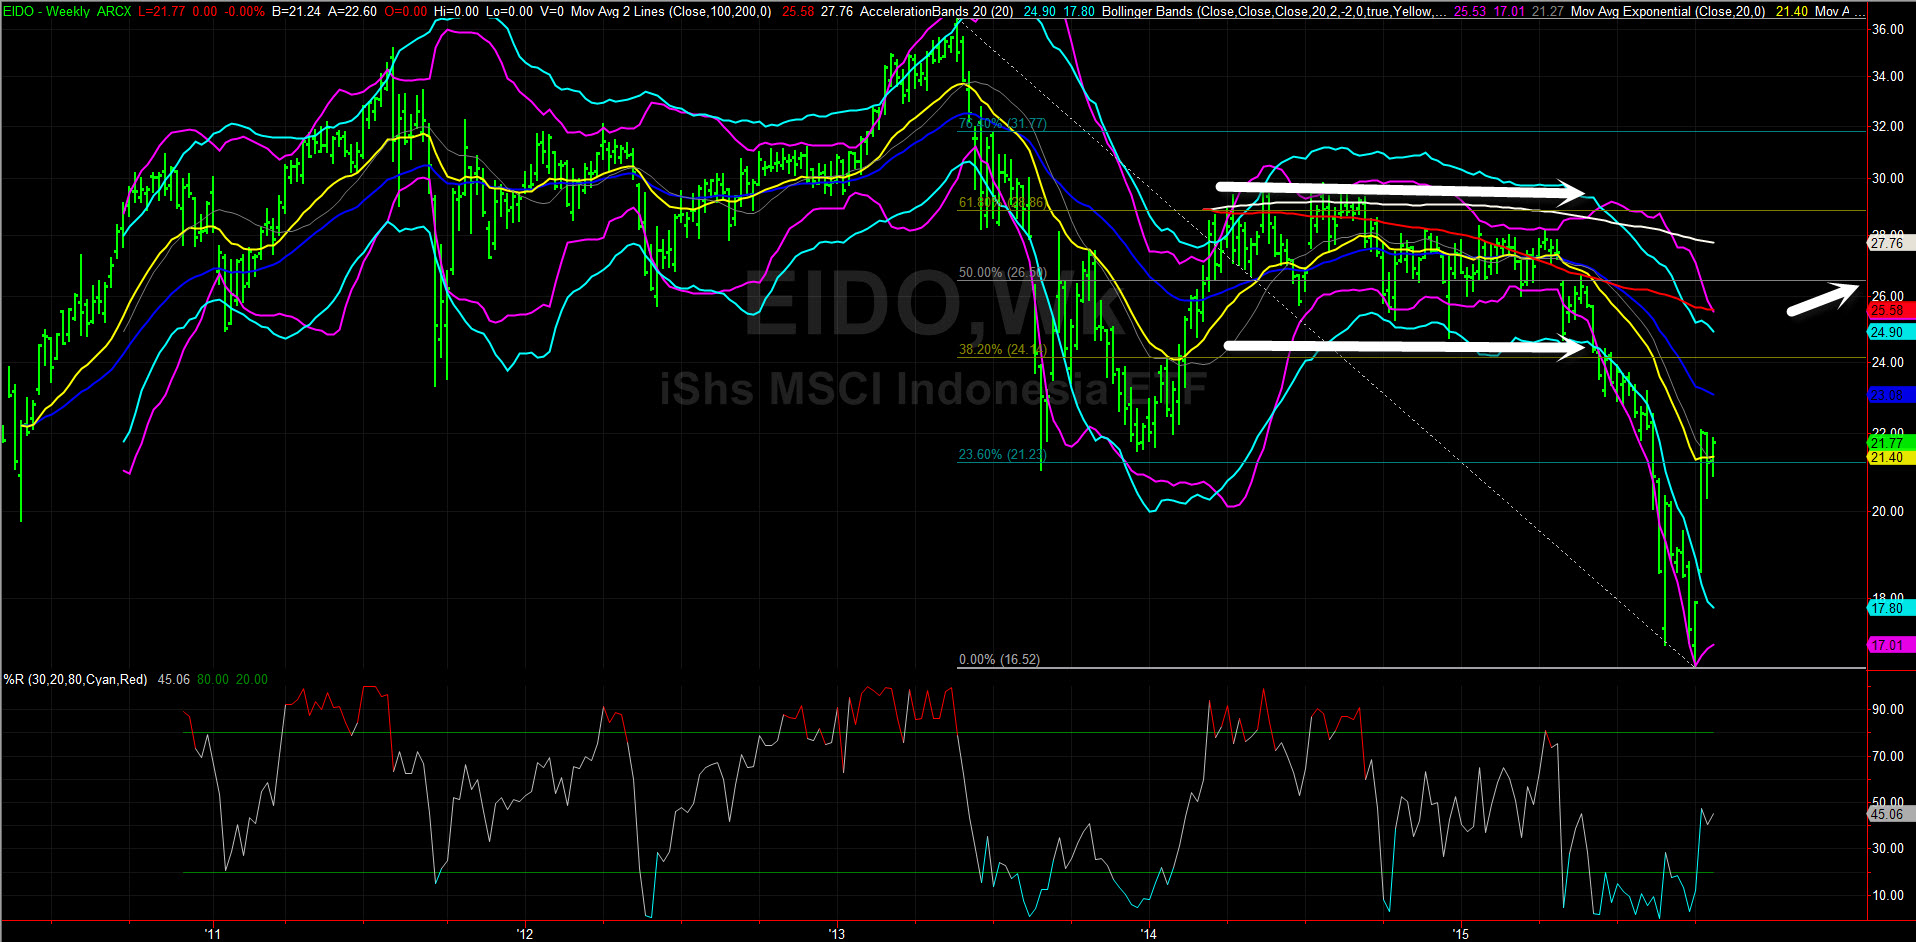
Putting a simple Fibonacci Retracement from they key high in 2013 to the 2015 key low gives us levels to watch. The 50% retracement is a common one and gives an upside target up to 26.50 on the current rebound. More broadly, EIDO would seem likely to move back into the 24.14 to 28.86 area, which is the site of Fibonacci Retracements and also encompasses the ETFs range in most of 2014. With the ETF currently around 21.75, the move up to 24+ still provides some nice potential upside (10%+) -- keep in mind, however, that this is a long-term Weekly chart and could take some time to play out.
The Losers
The worst performing ETFs of October 2015 include:
| Option Volatility | (VXX) | -22.55% |
| Health Care | (FXH) | -10.79% |
| Natural Gas | (UNG) | -10.47% |
| Biotechnology | (IBB) | -8.02% |
| REITs | (REM) | -4.55% |
| Cyber Security | (HACK) | -1.75% |
| Russell 2k Growth | (IWO) | -1.62% |
| Euro Currency | (FXE) | -0.67% |
| US Dollar | (UUP) | -0.12% |
| Retail | (XRT) | -0.11% |
VXX & UNG are two ETFs that seem structurally flawed to move lower over time, we've discussed previously that those securities should be traded/invested in with caution by long-side investors/traders.
Notable on the list is the continued underperformance of Health Care & Biotechnology. Biotech had a massive run from 2009 to 2015, so a pullback is somewhat to be expected here -- we examined different Biotech ETFs in this recent article.
The bottom 5 on the list above are around break-even, which shows the overall strength in equities in October in general.
by Moby Waller
co-Portfolio Manager, ETFTRADR and Rapid Options Income
BigTrends.com
1-800-244-8736